
Create successful ePaper yourself
Turn your PDF publications into a flip-book with our unique Google optimized e-Paper software.
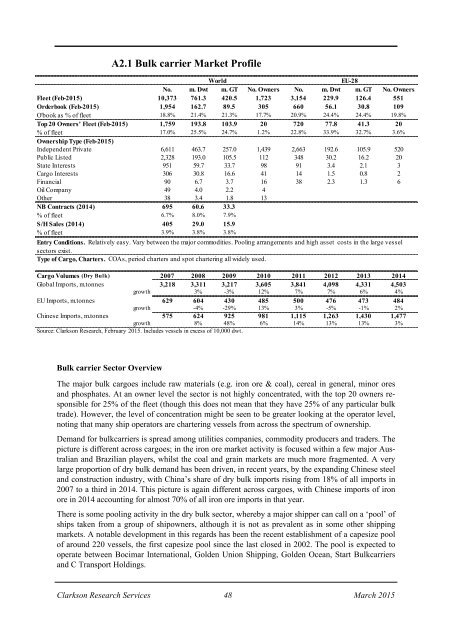
A2.1 Bulk carrier <strong><strong>Mar</strong>ket</strong> Profile<br />
World<br />
EU-28<br />
No. m. Dwt m. GT No. Owners No. m. Dwt m. GT No. Owners<br />
Fleet (Feb-<strong>2015</strong>) 10,373 761.3 420.5 1,723 3,154 229.9 126.4 551<br />
Orderbook (Feb-<strong>2015</strong>) 1,954 162.7 89.5 305 660 56.1 30.8 109<br />
O'book as % of fleet 18.8% 21.4% 21.3% 17.7% 20.9% 24.4% 24.4% 19.8%<br />
Top 20 Owners' Fleet (Feb-<strong>2015</strong>) 1,759 193.8 103.9 20 720 77.8 41.3 20<br />
% of fleet 17.0% 25.5% 24.7% 1.2% 22.8% 33.9% 32.7% 3.6%<br />
Ownership Type (Feb-<strong>2015</strong>)<br />
Independent Private 6,611 463.7 257.0 1,439 2,663 192.6 105.9 520<br />
Public Listed 2,328 193.0 105.5 112 348 30.2 16.2 20<br />
State Interests 951 59.7 33.7 98 91 3.4 2.1 3<br />
Cargo Interests 306 30.8 16.6 41 14 1.5 0.8 2<br />
Financial 90 6.7 3.7 16 38 2.3 1.3 6<br />
Oil Company 49 4.0 2.2 4<br />
Other 38 3.4 1.8 13<br />
NB Contracts (2014) 695 60.6 33.3<br />
% of fleet 6.7% 8.0% 7.9%<br />
S/H Sales (2014) 405 29.0 15.9<br />
% of fleet 3.9% 3.8% 3.8%<br />
Entry Conditions. Relatively easy. Vary between the major commodities. Pooling arrangements and high asset costs in the large vessel<br />
sectors exist.<br />
Type of Cargo, Charters. COAs, period charters and spot chartering all widely used.<br />
Cargo Volumes (Dry Bulk) 2007 2008 2009 2010 2011 2012 2013 2014<br />
Global Imports, m.tonnes 3,218 3,311 3,217 3,605 3,841 4,098 4,331 4,503<br />
growth 3% -3% 12% 7% 7% 6% 4%<br />
EU Imports, m.tonnes 629 604 430 485 500 476 473 484<br />
growth -4% -29% 13% 3% -5% -1% 2%<br />
Chinese Imports, m.tonnes 575 624 925 981 1,115 1,263 1,430 1,477<br />
growth 8% 48% 6% 14% 13% 13% 3%<br />
Source: Clarkson Research, February <strong>2015</strong>. Includes vessels in excess of 10,000 dwt.<br />
Bulk carrier Sector Overview<br />
<strong>The</strong> major bulk cargoes include raw materials (e.g. iron ore & coal), cereal in general, minor ores<br />
and phosphates. At an owner level the sector is not highly concentrated, with the top 20 owners responsible<br />
for 25% of the fleet (though this does not mean that they have 25% of any particular bulk<br />
trade). However, the level of concentration might be seen to be greater looking at the operator level,<br />
noting that many ship operators are chartering vessels from across the spectrum of ownership.<br />
Demand for bulkcarriers is spread among utilities companies, commodity producers and traders. <strong>The</strong><br />
picture is different across cargoes; in the iron ore market activity is focused within a few major Australian<br />
and Brazilian players, whilst the coal and grain markets are much more fragmented. A very<br />
large proportion of dry bulk demand has been driven, in recent years, by the expanding Chinese steel<br />
and construction industry, with China’s share of dry bulk imports rising from 18% of all imports in<br />
2007 to a third in 2014. This picture is again different across cargoes, with Chinese imports of iron<br />
ore in 2014 accounting for almost 70% of all iron ore imports in that year.<br />
<strong>The</strong>re is some pooling activity in the dry bulk sector, whereby a major shipper can call on a ‘pool’ of<br />
ships taken from a group of shipowners, although it is not as prevalent as in some other shipping<br />
markets. A notable development in this regards has been the recent establishment of a capesize pool<br />
of around 220 vessels, the first capesize pool since the last closed in 2002. <strong>The</strong> pool is expected to<br />
operate between Bocimar International, Golden Union <strong>Shipping</strong>, Golden Ocean, Start Bulkcarriers<br />
and C Transport Holdings.<br />
Clarkson Research Services 48 <strong>Mar</strong>ch <strong>2015</strong>