

Maize in India: Production Systems, Constraints - AgEcon Search
Maize in India: Production Systems, Constraints - AgEcon Search
Maize in India: Production Systems, Constraints - AgEcon Search

You also want an ePaper? Increase the reach of your titles
YUMPU automatically turns print PDFs into web optimized ePapers that Google loves.
4<br />
2. <strong>Maize</strong> <strong>Production</strong> Trends and <strong>Systems</strong><br />
2.1 <strong>Maize</strong> <strong>Production</strong> Trends<br />
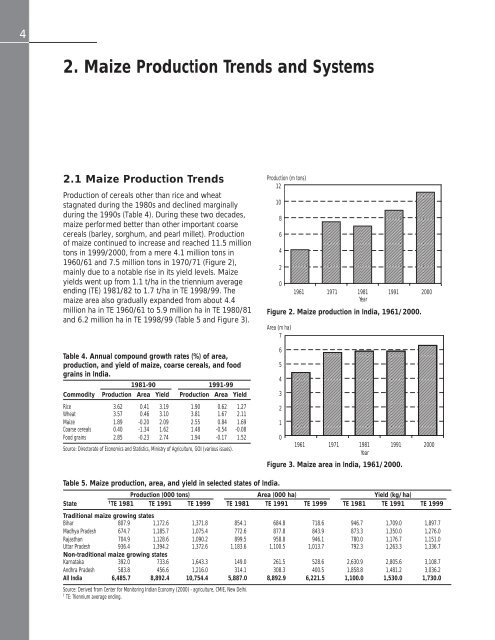
<strong>Production</strong> of cereals other than rice and wheat<br />
stagnated dur<strong>in</strong>g the 1980s and decl<strong>in</strong>ed marg<strong>in</strong>ally<br />
dur<strong>in</strong>g the 1990s (Table 4). Dur<strong>in</strong>g these two decades,<br />
maize performed better than other important coarse<br />
cereals (barley, sorghum, and pearl millet). <strong>Production</strong><br />
of maize cont<strong>in</strong>ued to <strong>in</strong>crease and reached 11.5 million<br />
tons <strong>in</strong> 1999/2000, from a mere 4.1 million tons <strong>in</strong><br />
1960/61 and 7.5 million tons <strong>in</strong> 1970/71 (Figure 2),<br />
ma<strong>in</strong>ly due to a notable rise <strong>in</strong> its yield levels. <strong>Maize</strong><br />
yields went up from 1.1 t/ha <strong>in</strong> the triennium average<br />
end<strong>in</strong>g (TE) 1981/82 to 1.7 t/ha <strong>in</strong> TE 1998/99. The<br />
maize area also gradually expanded from about 4.4<br />
million ha <strong>in</strong> TE 1960/61 to 5.9 million ha <strong>in</strong> TE 1980/81<br />
and 6.2 million ha <strong>in</strong> TE 1998/99 (Table 5 and Figure 3).<br />
Table 4. Annual compound growth rates (%) of area,<br />
production, and yield of maize, coarse cereals, and food<br />
gra<strong>in</strong>s <strong>in</strong> <strong>India</strong>.<br />
1981-90 1991-99<br />
Commodity <strong>Production</strong> Area Yield <strong>Production</strong> Area Yield<br />
Rice 3.62 0.41 3.19 1.90 0.62 1.27<br />
Wheat 3.57 0.46 3.10 3.81 1.67 2.11<br />
<strong>Maize</strong> 1.89 -0.20 2.09 2.55 0.84 1.69<br />
Coarse cereals 0.40 -1.34 1.62 1.48 -0.54 -0.08<br />
Food gra<strong>in</strong>s 2.85 -0.23 2.74 1.94 -0.17 1.52<br />
Source: Directorate of Economics and Statistics, M<strong>in</strong>istry of Agriculture, GOI (various issues).<br />
<strong>Production</strong> (m tons)<br />
12<br />
10<br />
8<br />
6<br />
4<br />
2<br />
0<br />
1961 1971 1981 1991 2000<br />
Year<br />
Figure 2. <strong>Maize</strong> production <strong>in</strong> <strong>India</strong>, 1961/2000.<br />
Area (m ha)<br />
7<br />
6<br />
5<br />
4<br />
3<br />
2<br />
1<br />
0<br />
1961 1971 1981 1991 2000<br />
Year<br />
Figure 3. <strong>Maize</strong> area <strong>in</strong> <strong>India</strong>, 1961/2000.<br />
Table 5. <strong>Maize</strong> production, area, and yield <strong>in</strong> selected states of <strong>India</strong>.<br />
<strong>Production</strong> (000 tons) Area (000 ha) Yield (kg/ha)<br />
State †<br />
TE 1981 TE 1991 TE 1999 TE 1981 TE 1991 TE 1999 TE 1981 TE 1991 TE 1999<br />
Traditional maize grow<strong>in</strong>g states<br />
Bihar 807.9 1,172.6 1,371.8 854.1 684.8 718.6 946.7 1,709.0 1,897.7<br />
Madhya Pradesh 674.7 1,185.7 1,075.4 772.6 877.8 843.9 873.3 1,350.0 1,276.0<br />
Rajasthan 704.9 1,128.6 1,090.2 899.5 958.8 946.1 780.0 1,176.7 1,151.0<br />
Uttar Pradesh 936.4 1,394.2 1,372.6 1,183.6 1,100.5 1,013.7 792.3 1,263.3 1,336.7<br />
Non-traditional maize grow<strong>in</strong>g states<br />
Karnataka 392.0 733.6 1,643.3 149.0 261.5 528.6 2,630.9 2,805.6 3,108.7<br />
Andhra Pradesh 583.8 456.6 1,216.0 314.1 308.3 400.5 1,858.8 1,481.2 3,036.2<br />
All <strong>India</strong> 6,485.7 8,892.4 10,754.4 5,887.0 8,892.9 6,221.5 1,100.0 1,530.0 1,730.0<br />
Source: Derived from Center for Monitor<strong>in</strong>g <strong>India</strong>n Economy (2000) - agriculture, CMIE, New Delhi.<br />
†<br />
TE: Triennium average end<strong>in</strong>g.


