

Maize in India: Production Systems, Constraints - AgEcon Search
Maize in India: Production Systems, Constraints - AgEcon Search
Maize in India: Production Systems, Constraints - AgEcon Search

You also want an ePaper? Increase the reach of your titles
YUMPU automatically turns print PDFs into web optimized ePapers that Google loves.
12<br />
different types of maize varieties grown. However,<br />
maize production <strong>in</strong> some areas, such as Jhabua and<br />
Mandsaur <strong>in</strong> Madhya Pradesh, Hardoi <strong>in</strong> Uttar Pradesh,<br />
and Udaipur and Bhilwara <strong>in</strong> Rajasthan, was much less<br />
mechanized as compared to the Bulandshar district of<br />
Uttar Pradesh, where average tractor power use was<br />
26.4 mach<strong>in</strong>e-hours/ha, and animal power use was<br />
negligible. In terms of the share of total operational<br />
costs, that of mach<strong>in</strong>e power ranged from 7% (10.3<br />
mach<strong>in</strong>e-hours/ha) to 13% (26.2 mach<strong>in</strong>e-hours/ha).<br />
Overall, current <strong>in</strong>put use <strong>in</strong> <strong>India</strong>n maize production is<br />
far below recommended levels. Inorganic fertilizers are<br />
applied with the use of improved cultivars and<br />
irrigation. In the Jhabua district of Madhya Pradesh,<br />
where farmers are very poor, maize is grown <strong>in</strong><br />
marg<strong>in</strong>al ra<strong>in</strong>fed environments, not fertilized at all, and<br />
grown only for subsistence. Across the surveyed<br />
districts/states, fertilizer use <strong>in</strong> maize production ranged<br />
from 38.4 kg/ha <strong>in</strong> Hardoi, Uttar Pradesh, to 329.4 kg/<br />
ha <strong>in</strong> Nizamabad, Andhra Pradesh. <strong>Maize</strong> farmers also<br />
commonly applied farmyard manure, vary<strong>in</strong>g from 500<br />
kg/ha for local/traditional varieties <strong>in</strong> Begusarai, Bihar,<br />
to 5.7 t/ha for hybrid pr oduction <strong>in</strong> Nizamabad, Andhra<br />
Pradesh. The use of fertilizers and FYM was higher <strong>in</strong> the<br />
non-traditional hybrid maize grow<strong>in</strong>g areas. The<br />
availability and use of FYM varied from one household<br />
to another, depend<strong>in</strong>g ma<strong>in</strong>ly on the number of farm<br />
animals reared at home. S<strong>in</strong>ce most farmers cont<strong>in</strong>ue to<br />
grow local/traditional cultivars under ra<strong>in</strong>fed conditions,<br />
the use of other material <strong>in</strong>puts is also low. As such,<br />
there is enough scope for rais<strong>in</strong>g nutrient use across all<br />
maize types <strong>in</strong> all study sites, to <strong>in</strong>cr ease maize<br />
production levels <strong>in</strong> <strong>India</strong>.<br />
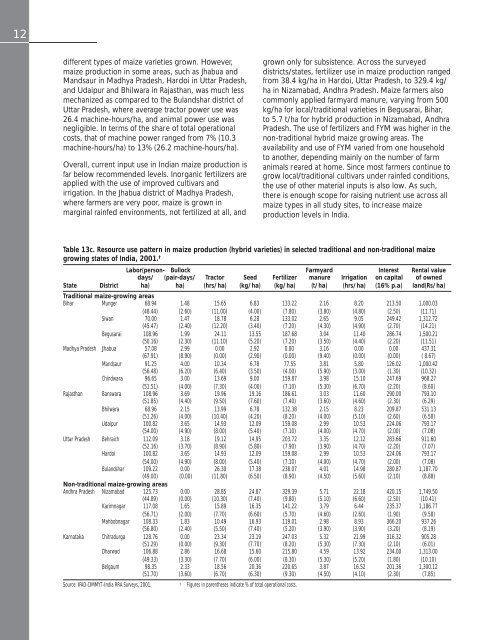
Table 13c. Resource use pattern <strong>in</strong> maize production (hybrid varieties) <strong>in</strong> selected traditional and non-traditional maize<br />
grow<strong>in</strong>g states of <strong>India</strong>, 2001. †<br />
Labor(person- Bullock Farmyard Interest Rental value<br />
days/ (pair-days/ Tractor Seed Fertilizer manure Irrigation on capital of owned<br />
State District ha) ha) (hrs/ha) (kg/ha) (kg/ha) (t/ha) (hrs/ha) (16% p.a) land(Rs/ha)<br />
Traditional maize-grow<strong>in</strong>g areas<br />
Bihar Munger 68.94 1.48 15.65 6.83 133.22 2.16 8.20 213.50 1,000.03<br />
(48.44) (2.60) (11.00) (4.00) (7.80) (3.80) (4.80) (2.50) (11.71)<br />
Siwan 70.00 1.47 18.78 6.28 133.02 2.65 9.05 249.42 1,312.72<br />
(45.47) (2.40) (12.20) (3.40) (7.20) (4.30) (4.90) (2.70) (14.21)<br />
Begusarai 108.96 1.99 24.11 13.55 187.68 3.04 11.40 286.74 1,500.21<br />
(50.16) (2.30) (11.10) (5.20) (7.20) (3.50) (4.40) (2.20) (11.51)<br />
Madhya Pradesh Jhabua 57.08 2.99 0.00 2.92 0.00 3.16 0.00 0.00 437.31<br />
(67.91) (8.90) (0.00) (2.90) (0.00) (9.40) (0.00) (0.00) ( 8.67)<br />
Mandsaur 91.25 4.00 10.34 6.78 77.55 3.81 5.80 126.02 1,000.42<br />
(56.48) (6.20) (6.40) (3.50) (4.00) (5.90) (3.00) (1.30) (10.32)<br />
Ch<strong>in</strong>dwara 96.65 3.00 13.69 9.00 159.87 3.98 15.10 247.69 968.27<br />
(51.51) (4.00) (7.30) (4.00) (7.10) (5.30) (6.70) (2.20) (8.60)<br />
Rajasthan Banswara 108.96 3.69 19.96 19.16 186.61 3.03 11.60 290.00 793.10<br />
(51.85) (4.40) (9.50) (7.60) (7.40) (3.60) (4.60) (2.30) (6.29)<br />
Bhilwara 68.96 2.15 13.99 6.78 132.38 2.15 8.23 209.87 531.13<br />
(51.26) (4.00) (10.40) (4.20) (8.20) (4.00) (5.10) (2.60) (6.58)<br />
Udaipur 100.82 3.65 14.93 12.09 159.08 2.99 10.53 224.06 793.17<br />
(54.00) (4.90) (8.00) (5.40) (7.10) (4.00) (4.70) (2.00) (7.08)<br />
Uttar Pradesh Behraich 112.09 3.18 19.12 14.95 203.72 3.35 12.12 283.66 911.60<br />
(52.16) (3.70) (8.90) (5.80) (7.90) (3.90) (4.70) (2.20) (7.07)<br />
Hardoi 100.82 3.65 14.93 12.09 159.08 2.99 10.53 224.06 793.17<br />
(54.00) (4.90) (8.00) (5.40) (7.10) (4.00) (4.70) (2.00) (7.08)<br />
Bulandshar 109.22 0.00 26.30 17.38 238.07 4.01 14.98 280.87 1,187.70<br />
(49.00) (0.00) (11.80) (6.50) (8.90) (4.50) (5.60) (2.10) (8.88)<br />
Non-traditional maize-grow<strong>in</strong>g areas<br />
Andhra Pradesh Nizamabad 125.73 0.00 28.85 24.87 329.39 5.71 22.18 420.15 1,749.50<br />
(44.89) (0.00) (10.30) (7.40) (9.80) (5.10) (6.60) (2.50) (10.41)<br />
Karimnagar 117.08 1.65 15.89 16.35 141.22 3.79 6.44 235.37 1,186.77<br />
(56.71) (2.00) (7.70) (6.60) (5.70) (4.60) (2.60) (1.90) (9.58)<br />
Mahbobnagar 108.33 1.83 10.49 16.93 119.01 2.98 8.93 366.20 937.26<br />
(56.80) (2.40) (5.50) (7.40) (5.20) (3.90) (3.90) (3.20) (8.19)<br />
Karnataka Chitradurga 128.76 0.00 23.34 23.19 247.03 5.32 21.99 316.32 905.28<br />
(51.29) (0.00) (9.30) (7.70) (8.20) (5.30) (7.30) (2.10) (6.01)<br />
Dharwad 106.88 2.86 16.68 15.60 215.80 4.59 13.92 234.00 1,313.00<br />
(49.33) (3.30) (7.70) (6.00) (8.30) (5.30) (5.20) (1.80) (10.10)<br />
Belgaum 98.35 2.33 18.56 20.36 220.65 3.87 16.52 201.36 1,300.12<br />
(51.70) (3.60) (6.70) (6.30) (9.30) (4.50) (4.10) (2.30) (7.85)<br />
Source: IFAD-CIMMYT-<strong>India</strong> RRA Surveys, 2001.<br />
†<br />
Figures <strong>in</strong> parentheses <strong>in</strong>dicate % of total operational costs.


