

Maize in India: Production Systems, Constraints - AgEcon Search
Maize in India: Production Systems, Constraints - AgEcon Search
Maize in India: Production Systems, Constraints - AgEcon Search

Create successful ePaper yourself
Turn your PDF publications into a flip-book with our unique Google optimized e-Paper software.
5<br />
This is a clear <strong>in</strong>dication that maize is gradually<br />
spread<strong>in</strong>g to new areas and, to some extent, also<br />
replac<strong>in</strong>g barley, sorghum, and pearl millet as a feed<br />
and fodder crop.<br />
Dur<strong>in</strong>g 2001-02, as much as 70% of the maize grown <strong>in</strong><br />
<strong>India</strong> was cultivated <strong>in</strong> six states (Andhra Pradesh, Bihar,<br />
Karnataka, Madhya Pradesh, Rajasthan, and Uttar<br />
Pradesh). In 1999/2000, the national average maize<br />
yield (1.8 t/ha) was far beh<strong>in</strong>d the world average of<br />
4.86 t/ha. Dur<strong>in</strong>g this period, the average maize yield<br />
on about 45% of the total maize area <strong>in</strong> <strong>India</strong> was less<br />
than 1.5 t/ha, and on only 15% was it slightly more<br />
than 3 t/ha. Lower yields and higher production costs <strong>in</strong><br />
<strong>India</strong>, as compared to other countries, made maize<br />
non-competitive on the <strong>in</strong>ternational market. In a<br />
globally competitive environment, maize yields <strong>in</strong> <strong>India</strong><br />
need to <strong>in</strong>crease to protect the maize producer.<br />
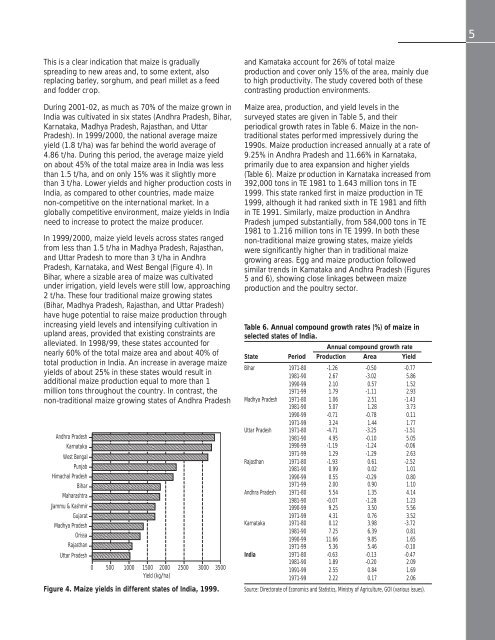
In 1999/2000, maize yield levels across states ranged<br />
from less than 1.5 t/ha <strong>in</strong> Madhya Pradesh, Rajasthan,<br />
and Uttar Pradesh to more than 3 t/ha <strong>in</strong> Andhra<br />
Pradesh, Karnataka, and West Bengal (Figure 4). In<br />
Bihar, where a sizable area of maize was cultivated<br />
under irrigation, yield levels were still low, approach<strong>in</strong>g<br />
2 t/ha. These four traditional maize grow<strong>in</strong>g states<br />
(Bihar, Madhya Pradesh, Rajasthan, and Uttar Pradesh)<br />
have huge potential to raise maize production through<br />
<strong>in</strong>creas<strong>in</strong>g yield levels and <strong>in</strong>tensify<strong>in</strong>g cultivation <strong>in</strong><br />
upland areas, provided that exist<strong>in</strong>g constra<strong>in</strong>ts are<br />
alleviated. In 1998/99, these states accounted for<br />
nearly 60% of the total maize area and about 40% of<br />
total production <strong>in</strong> <strong>India</strong>. An <strong>in</strong>crease <strong>in</strong> average maize<br />
yields of about 25% <strong>in</strong> these states would result <strong>in</strong><br />
additional maize production equal to more than 1<br />
million tons throughout the country. In contrast, the<br />
non-traditional maize grow<strong>in</strong>g states of Andhra Pradesh<br />
Andhra Pradesh<br />
Karnataka<br />
West Bengal<br />
Punjab<br />
Himachal Pradesh<br />
Bihar<br />
Maharashtra<br />
Jammu & Kashmir<br />
Gujarat<br />
Madhya Pradesh<br />
Orissa<br />
Rajasthan<br />
Uttar Pradesh<br />
0 500 1000 1500 2000 2500 3000 3500<br />
Yield (kg/ha)<br />
Figure 4. <strong>Maize</strong> yields <strong>in</strong> different states of <strong>India</strong>, 1999.<br />
and Karnataka account for 26% of total maize<br />
production and cover only 15% of the area, ma<strong>in</strong>ly due<br />
to high productivity. The study covered both of these<br />
contrast<strong>in</strong>g production environments.<br />
<strong>Maize</strong> area, production, and yield levels <strong>in</strong> the<br />
surveyed states are given <strong>in</strong> Table 5, and their<br />
periodical growth rates <strong>in</strong> Table 6. <strong>Maize</strong> <strong>in</strong> the nontraditional<br />
states performed impressively dur<strong>in</strong>g the<br />
1990s. <strong>Maize</strong> production <strong>in</strong>creased annually at a rate of<br />
9.25% <strong>in</strong> Andhra Pradesh and 11.66% <strong>in</strong> Karnataka,<br />
primarily due to area expansion and higher yields<br />
(Table 6). <strong>Maize</strong> pr oduction <strong>in</strong> Karnataka <strong>in</strong>creased from<br />
392,000 tons <strong>in</strong> TE 1981 to 1.643 million tons <strong>in</strong> TE<br />
1999. This state ranked first <strong>in</strong> maize production <strong>in</strong> TE<br />
1999, although it had ranked sixth <strong>in</strong> TE 1981 and fifth<br />
<strong>in</strong> TE 1991. Similarly, maize production <strong>in</strong> Andhra<br />
Pradesh jumped substantially, from 584,000 tons <strong>in</strong> TE<br />
1981 to 1.216 million tons <strong>in</strong> TE 1999. In both these<br />
non-traditional maize grow<strong>in</strong>g states, maize yields<br />
were significantly higher than <strong>in</strong> traditional maize<br />
grow<strong>in</strong>g areas. Egg and maize production followed<br />
similar trends <strong>in</strong> Karnataka and Andhra Pradesh (Figures<br />
5 and 6), show<strong>in</strong>g close l<strong>in</strong>kages between maize<br />
production and the poultry sector.<br />
Table 6. Annual compound growth rates (%) of maize <strong>in</strong><br />
selected states of <strong>India</strong>.<br />
Annual compound growth rate<br />
State Period <strong>Production</strong> Area Yield<br />
Bihar 1971-80 -1.26 -0.50 -0.77<br />
1981-90 2.67 -3.02 5.86<br />
1990-99 2.10 0.57 1.52<br />
1971-99 1.79 -1.11 2.93<br />
Madhya Pradesh 1971-80 1.06 2.51 -1.43<br />
1981-90 5.07 1.28 3.73<br />
1990-99 -0.71 -0.78 0.11<br />
1971-99 3.24 1.44 1.77<br />
Uttar Pradesh 1971-80 -4.71 -3.25 -1.51<br />
1981-90 4.95 -0.10 5.05<br />
1990-99 -1.19 -1.24 -0.06<br />
1971-99 1.29 -1.29 2.63<br />
Rajasthan 1971-80 -1.93 0.61 -2.52<br />
1981-90 0.99 0.02 1.01<br />
1990-99 0.55 -0.29 0.80<br />
1971-99 2.00 0.90 1.10<br />
Andhra Pradesh 1971-80 5.54 1.35 4.14<br />
1981-90 -0.07 -1.28 1.23<br />
1990-99 9.25 3.50 5.56<br />
1971-99 4.31 0.76 3.52<br />
Karnataka 1971-80 0.12 3.98 -3.72<br />
1981-90 7.25 6.39 0.81<br />
1990-99 11.66 9.85 1.65<br />
1971-99 5.36 5.46 -0.10<br />
<strong>India</strong> 1971-80 -0.63 -0.13 -0.47<br />
1981-90 1.89 -0.20 2.09<br />
1991-99 2.55 0.84 1.69<br />
1971-99 2.22 0.17 2.06<br />
Source: Directorate of Economics and Statistics, M<strong>in</strong>istry of Agriculture, GOI (various issues).


