

Maize in India: Production Systems, Constraints - AgEcon Search
Maize in India: Production Systems, Constraints - AgEcon Search
Maize in India: Production Systems, Constraints - AgEcon Search

Create successful ePaper yourself
Turn your PDF publications into a flip-book with our unique Google optimized e-Paper software.
11<br />
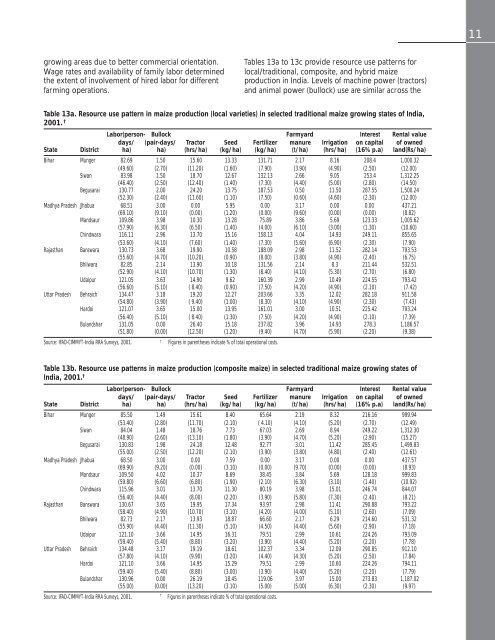
grow<strong>in</strong>g areas due to better commercial orientation.<br />
Wage rates and availability of family labor determ<strong>in</strong>ed<br />
the extent of <strong>in</strong>volvement of hired labor for different<br />
farm<strong>in</strong>g operations.<br />
Tables 13a to 13c provide resource use patterns for<br />
local/traditional, composite, and hybrid maize<br />
production <strong>in</strong> <strong>India</strong>. Levels of mach<strong>in</strong>e power (tractors)<br />
and animal power (bullock) use are similar across the<br />
Table 13a. Resource use pattern <strong>in</strong> maize production (local varieties) <strong>in</strong> selected traditional maize grow<strong>in</strong>g states of <strong>India</strong>,<br />
2001. † Labor(person- Bullock Farmyard Interest Rental value<br />
days/ (pair-days/ Tractor Seed Fertilizer manure Irrigation on capital of owned<br />
State District ha) ha) (hrs/ha) (kg/ha) (kg/ha) (t/ha) (hrs/ha) (16% p.a) land(Rs/ha)<br />
Bihar Munger 82.69 1.50 15.60 13.33 131.71 2.17 8.16 208.4 1,000.32<br />
(49.60) (2.70) (11.20) (1.60) (7.90) (3.90) (4.90) (2.50) (12.00)<br />
Siwan 83.98 1.50 18.70 12.67 132.13 2.66 9.05 253.4 1,312.25<br />
(46.40) (2.50) (12.40) (1.40) (7.30) (4.40) (5.00) (2.80) (14.50)<br />
Begusarai 130.77 2.00 24.20 13.75 187.53 0.50 11.50 287.55 1,500.24<br />
(52.30) (2.40) (11.60) (1.10) (7.50) (0.60) (4.60) (2.30) (12.00)<br />
Madhya Pradesh Jhabua 68.51 3.00 0.00 5.95 0.00 3.17 0.00 0.00 437.21<br />
(69.10) (9.10) (0.00) (1.20) (0.00) (9.60) (0.00) (0.00) (8.82)<br />
Mandsaur 109.86 3.98 10.30 13.28 75.89 3.86 5.69 123.33 1,005.62<br />
(57.90) (6.30) (6.50) (1.40) (4.00) (6.10) (3.00) (1.30) (10.60)<br />
Ch<strong>in</strong>dwara 116.11 2.96 13.70 15.16 158.13 4.04 14.93 249.11 855.65<br />
(53.60) (4.10) (7.60) (1.40) (7.30) (5.60) (6.90) (2.30) (7.90)<br />
Rajasthan Banswara 130.73 3.68 19.90 10.58 188.09 2.98 11.52 282.14 793.53<br />
(55.60) (4.70) (10.20) (0.90) (8.00) (3.80) (4.90) (2.40) (6.75)<br />
Bhilwara 82.85 2.14 13.90 10.18 131.56 2.14 8.3 211.44 532.51<br />
(52.90) (4.10) (10.70) (1.30) (8.40) (4.10) (5.30) (2.70) (6.80)<br />
Udaipur 121.05 3.63 14.90 9.62 160.39 2.99 10.49 224.55 793.42<br />
(56.60) (5.10) ( 8.40) (0.90) (7.50) (4.20) (4.90) (2.10) (7.42)<br />
Uttar Pradesh Behraich 134.47 3.18 19.20 12.27 203.66 3.35 12.02 282.18 911.58<br />
(54.80) (3.90) ( 9.40) (1.00) (8.30) (4.10) (4.90) (2.30) (7.43)<br />
Hardoi 121.07 3.65 15.00 13.95 161.01 3.00 10.51 225.42 793.24<br />
(56.40) (5.10) ( 8.40) (1.30) (7.50) (4.20) (4.90) (2.10) (7.39)<br />
Bulandshar 131.05 0.00 26.40 15.18 237.82 3.96 14.93 278.3 1,186.57<br />
(51.80) (0.00) (12.50) (1.20) (9.40) (4.70) (5.90) (2.20) (9.38)<br />
Source: IFAD-CIMMYT-<strong>India</strong> RRA Surveys, 2001.<br />
†<br />
Figures <strong>in</strong> parentheses <strong>in</strong>dicate % of total operational costs.<br />
Table 13b. Resource use patterns <strong>in</strong> maize production (composite maize) <strong>in</strong> selected traditional maize grow<strong>in</strong>g states of<br />
<strong>India</strong>, 2001. † Labor(person- Bullock Farmyard Interest Rental value<br />
days/ (pair-days/ Tractor Seed Fertilizer manure Irrigation on capital of owned<br />
State District ha) ha) (hrs/ha) (kg/ha) (kg/ha) (t/ha) (hrs/ha) (16% p.a) land(Rs/ha)<br />
Bihar Munger 85.50 1.49 15.61 8.40 65.64 2.19 8.32 216.16 999.94<br />
(53.40) (2.80) (11.70) (2.10) ( 4.10) (4.10) (5.20) (2.70) (12.49)<br />
Siwan 84.04 1.48 18.76 7.73 67.03 2.69 8.94 249.22 1,312.30<br />
(48.90) (2.60) (13.10) (1.80) (3.90) (4.70) (5.20) (2.90) (15.27)<br />
Begusarai 130.83 1.98 24.18 12.48 92.77 3.01 11.42 285.45 1,499.83<br />
(55.00) (2.50) (12.20) (2.10) (3.90) (3.80) (4.80) (2.40) (12.61)<br />
Madhya Pradesh Jhabua 68.50 3.00 0.00 7.59 0.00 3.17 0.00 0.00 437.57<br />
(69.90) (9.20) (0.00) (3.10) (0.00) (9.70) (0.00) (0.00) (8.93)<br />
Mandsaur 109.50 4.02 10.37 8.69 38.45 3.84 5.69 128.18 999.83<br />
(59.80) (6.60) (6.80) (1.90) (2.10) (6.30) (3.10) (1.40) (10.92)<br />
Ch<strong>in</strong>dwara 115.96 3.01 13.70 11.30 80.19 3.98 15.01 246.74 844.07<br />
(56.40) (4.40) (8.00) (2.20) (3.90) (5.80) (7.30) (2.40) (8.21)<br />
Rajasthan Banswara 130.67 3.65 19.95 17.34 93.97 2.98 11.41 290.88 793.22<br />
(58.40) (4.90) (10.70) (3.10) (4.20) (4.00) (5.10) (2.60) (7.09)<br />
Bhilwara 82.73 2.17 13.93 18.87 66.60 2.17 6.29 214.60 531.32<br />
(55.90) (4.40) (11.30) (5.10) (4.50) (4.40) (5.60) (2.90) (7.18)<br />
Udaipur 121.10 3.66 14.95 16.31 79.51 2.99 10.61 224.26 793.09<br />
(59.40) (5.40) (8.80) (3.20) (3.90) (4.40) (5.20) (2.20) (7.78)<br />
Uttar Pradesh Behraich 134.48 3.17 19.19 18.61 102.37 3.34 12.09 290.85 912.10<br />
(57.80) (4.10) (9.90) (3.20) (4.40) (4.30) (5.20) (2.50) (7.84)<br />
Hardoi 121.10 3.66 14.95 15.29 79.51 2.99 10.60 224.26 794.11<br />
(59.40) (5.40) (8.80) (3.00) (3.90) (4.40) (5.20) (2.20) (7.79)<br />
Bulandshar 130.96 0.00 26.19 18.45 119.06 3.97 15.00 273.83 1,187.02<br />
(55.00) (0.00) (13.20) (3.10) (5.00) (5.00) (6.30) (2.30) (9.97)<br />
Source: IFAD-CIMMYT-<strong>India</strong> RRA Surveys, 2001.<br />
†<br />
Figures <strong>in</strong> parentheses <strong>in</strong>dicate % of total operational costs.


