Maize in India: Production Systems, Constraints - AgEcon Search
Maize in India: Production Systems, Constraints - AgEcon Search
Maize in India: Production Systems, Constraints - AgEcon Search
You also want an ePaper? Increase the reach of your titles
YUMPU automatically turns print PDFs into web optimized ePapers that Google loves.
22<br />
4.1.3 Lack of markets<br />
Due to <strong>in</strong>adequately developed markets for maize,<br />
farmers usually received lower prices <strong>in</strong> village markets<br />
than <strong>in</strong> organized markets located some distance away.<br />
The loss due to non-existence of maize markets <strong>in</strong> a<br />
village is computed as follows:<br />
L m<br />
= {(PRM m<br />
– PRM v ) – TC m,v } * MQV<br />
where L m<br />
is the <strong>in</strong>come loss (<strong>in</strong> rupees) due to lack of<br />
markets <strong>in</strong> the village, PRM m<br />
is the price received by<br />
farmers <strong>in</strong> the nearest market (rupees/kg); PRM v<br />
is the<br />
price received by far mers <strong>in</strong> the village (rupees/kg);<br />
TC m,v<br />
is the transportation cost (<strong>in</strong> rupees/kg) between<br />
the organized market and the village; and MQV is the<br />
amount of maize (<strong>in</strong> kg) sold <strong>in</strong> the village.<br />
4.1.4 Non-availability of improved<br />
cultivars<br />
Due to a weak seed sector, farmers lacked access to<br />
higher-yield<strong>in</strong>g maize varieties, especially hybrids.<br />
Losses due to non-availability of improved cultivars,<br />
particularly hybrids, is computed as follows:<br />
L s<br />
= {(Y h<br />
– Y c<br />
) * A c<br />
+ (Y h<br />
– Y l<br />
) * (1-s) A l<br />
} * P m<br />
1<br />
where L s<br />
is the <strong>in</strong>come loss (<strong>in</strong> rupees) due to nonavailability<br />
of hybrid maize seed; Y h<br />
is the yield of<br />
hybrid maize (<strong>in</strong> kg/ha); Y c<br />
is the yield of composite<br />
maize (<strong>in</strong> kg/ha); Y l<br />
is the yield of local maize (<strong>in</strong> kg/<br />
ha); A c<br />
is the area under composite maize (hectares); A l<br />
is the area under local maize (hectares); s is the share<br />
(%) of maize farmers’ preference for local maize; (1-s) is<br />
the share (%) of maize farmers’ preference for hybrid<br />
maize; and P m<br />
is the price of maize (<strong>in</strong> rupees/kg).<br />
The value of damage became the criterion for rank<strong>in</strong>g<br />
farmer-identified maize productivity constra<strong>in</strong>ts <strong>in</strong><br />
<strong>India</strong>. The higher the value of the damage, the higher<br />
the constra<strong>in</strong>t ranked as a research priority. All<br />
production constra<strong>in</strong>ts were ranked accord<strong>in</strong>g to their<br />
share <strong>in</strong> production losses.<br />
1 A l<br />
, the area under local maize, has been multiplied by (1-s)<br />
on the assumption that farmers sow local maize due to<br />
non-availability of hybrids; thus if hybrids were made<br />
available, the current area under local varieties would<br />
switch over to hybrids. “Preferences” here refer to<br />
cultivat<strong>in</strong>g <strong>in</strong> a broad sense.<br />
4.2 Prioritization of <strong>Maize</strong><br />
<strong>Production</strong> Constra<strong>in</strong>ts<br />
4.2.1 Abiotic and biotic constra<strong>in</strong>ts<br />
Thirty-two abiotic and biotic production constra<strong>in</strong>ts<br />
were identified and prioritized based on the damage<br />
caused to maize production (Appendices 4, 5, and 6).<br />
The estimated total annual <strong>in</strong>come lost as a result of<br />
these constra<strong>in</strong>ts was about Rs. 17,541 million (US$<br />
399 million) <strong>in</strong> BIMARU states and about Rs. 14,800<br />
million (US$ 397 million) <strong>in</strong> KAP states.<br />
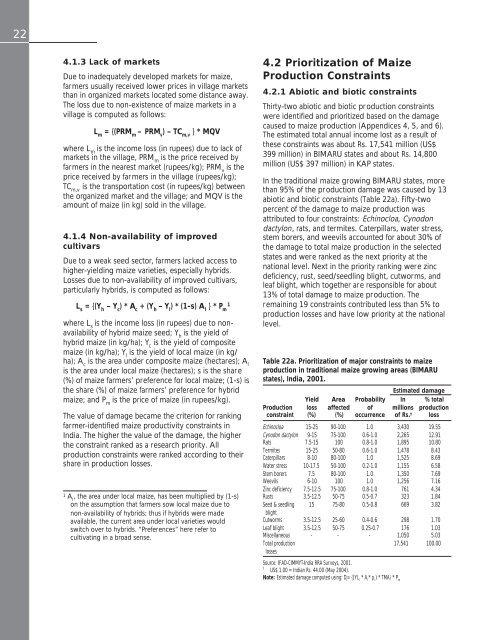
In the traditional maize grow<strong>in</strong>g BIMARU states, more<br />
than 95% of the pr oduction damage was caused by 13<br />
abiotic and biotic constra<strong>in</strong>ts (Table 22a). Fifty-two<br />
percent of the damage to maize production was<br />
attributed to four constra<strong>in</strong>ts: Ech<strong>in</strong>ocloa, Cynodon<br />
dactylon, rats, and termites. Caterpillars, water stress,<br />
stem borers, and weevils accounted for about 30% of<br />
the damage to total maize production <strong>in</strong> the selected<br />
states and were ranked as the next priority at the<br />
national level. Next <strong>in</strong> the priority rank<strong>in</strong>g were z<strong>in</strong>c<br />
deficiency, rust, seed/seedl<strong>in</strong>g blight, cutworms, and<br />
leaf blight, which together are responsible for about<br />
13% of total damage to maize production. The<br />
rema<strong>in</strong><strong>in</strong>g 19 constra<strong>in</strong>ts contributed less than 5% to<br />
production losses and have low priority at the national<br />
level.<br />
Table 22a. Prioritization of major constra<strong>in</strong>ts to maize<br />
production <strong>in</strong> traditional maize grow<strong>in</strong>g areas (BIMARU<br />
states), <strong>India</strong>, 2001.<br />
Estimated damage<br />
Yield Area Probability In % total<br />
<strong>Production</strong> loss affected of millions production<br />
constra<strong>in</strong>t (%) (%) occurrence of Rs. † loss<br />
Ech<strong>in</strong>ocloa 15-25 90-100 1.0 3,430 19.55<br />
Cynodon dactylon 9-15 75-100 0.6-1.0 2,265 12.91<br />
Rats 7.5-15 100 0.8-1.0 1,895 10.80<br />
Termites 15-25 50-80 0.6-1.0 1,478 8.43<br />
Caterpillars 8-10 80-100 1.0 1,525 8.69<br />
Water stress 10-17.5 50-100 0.2-1.0 1,155 6.58<br />
Stem borers 7.5 80-100 1.0 1,350 7.69<br />
Weevils 6-10 100 1.0 1,256 7.16<br />
Z<strong>in</strong>c deficiency 7.5-12.5 75-100 0.8-1.0 761 4.34<br />
Rusts 3.5-12.5 50-75 0.5-0.7 323 1.84<br />
Seed & seedl<strong>in</strong>g 15 75-80 0.5-0.8 669 3.82<br />
blight<br />
Cutworms 3.5-12.5 25-60 0.4-0.6 298 1.70<br />
Leaf blight 3.5-12.5 50-75 0.25-0.7 176 1.03<br />
Miscellaneous - - - 1,050 5.03<br />
Total production 17,541 100.00<br />
losses<br />
Source: IFAD-CIMMYT-<strong>India</strong> RRA Surveys, 2001.<br />
†<br />
US$ 1.00 = <strong>India</strong>n Rs. 44.00 (May 2004).<br />
Note: Estimated damage computed us<strong>in</strong>g: D i<br />
= {(YL i<br />
* A i<br />
* p i<br />
) * TMA} * P m


