

Maize in India: Production Systems, Constraints - AgEcon Search
Maize in India: Production Systems, Constraints - AgEcon Search
Maize in India: Production Systems, Constraints - AgEcon Search

You also want an ePaper? Increase the reach of your titles
YUMPU automatically turns print PDFs into web optimized ePapers that Google loves.
10<br />
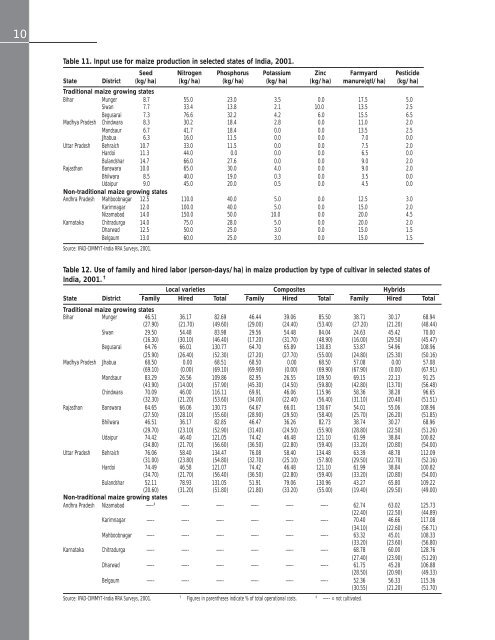
Table 11. Input use for maize production <strong>in</strong> selected states of <strong>India</strong>, 2001.<br />
Seed Nitrogen Phosphorus Potassium Z<strong>in</strong>c Farmyard Pesticide<br />
State District (kg/ha) (kg/ha) (kg/ha) (kg/ha) (kg/ha) manure(qtl/ha) (kg/ha)<br />
Traditional maize grow<strong>in</strong>g states<br />
Bihar Munger 8.7 55.0 23.0 3.5 0.0 17.5 5.0<br />
Siwan 7.7 33.4 13.8 2.1 10.0 13.5 2.5<br />
Begusarai 7.3 76.6 32.2 4.2 6.0 15.5 6.5<br />
Madhya Pradesh Ch<strong>in</strong>dwara 8.3 30.2 18.4 2.8 0.0 11.0 2.0<br />
Mandsaur 6.7 41.7 18.4 0.0 0.0 13.5 2.5<br />
Jhabua 6.3 16.0 11.5 0.0 0.0 7.0 0.0<br />
Uttar Pradesh Behraich 10.7 33.0 11.5 0.0 0.0 7.5 2.0<br />
Hardoi 11.3 44.0 0.0 0.0 0.0 6.5 0.0<br />
Bulandshar 14.7 66.0 27.6 0.0 0.0 9.0 2.0<br />
Rajasthan Banswara 10.0 65.0 30.0 4.0 0.0 9.0 2.0<br />
Bhilwara 8.5 40.0 19.0 0.3 0.0 3.5 0.0<br />
Udaipur 9.0 45.0 20.0 0.5 0.0 4.5 0.0<br />
Non-traditional maize grow<strong>in</strong>g states<br />
Andhra Pradesh Mahboobnagar 12.5 110.0 40.0 5.0 0.0 12.5 3.0<br />
Karimnagar 12.0 100.0 40.0 5.0 0.0 15.0 2.0<br />
Nizamabad 14.0 150.0 50.0 10.0 0.0 20.0 4.5<br />
Karnataka Chitradurga 14.0 75.0 28.0 5.0 0.0 20.0 2.0<br />
Dharwad 12.5 50.0 25.0 3.0 0.0 15.0 1.5<br />
Belgaum 13.0 60.0 25.0 3.0 0.0 15.0 1.5<br />
Source: IFAD-CIMMYT-<strong>India</strong> RRA Surveys, 2001.<br />
Table 12. Use of family and hired labor (person-days/ha) <strong>in</strong> maize production by type of cultivar <strong>in</strong> selected states of<br />
<strong>India</strong>, 2001. † Local varieties Composites Hybrids<br />
State District Family Hired Total Family Hired Total Family Hired Total<br />
Traditional maize grow<strong>in</strong>g states<br />
Bihar Munger 46.51 36.17 82.69 46.44 39.06 85.50 38.71 30.17 68.94<br />
(27.90) (21.70) (49.60) (29.00) (24.40) (53.40) (27.20) (21.20) (48.44)<br />
Siwan 29.50 54.48 83.98 29.56 54.48 84.04 24.63 45.42 70.00<br />
(16.30) (30.10) (46.40) (17.20) (31.70) (48.90) (16.00) (29.50) (45.47)<br />
Begusarai 64.76 66.01 130.77 64.70 65.89 130.83 53.87 54.96 108.96<br />
(25.90) (26.40) (52.30) (27.20) (27.70) (55.00) (24.80) (25.30) (50.16)<br />
Madhya Pradesh Jhabua 68.50 0.00 68.51 68.50 0.00 68.50 57.08 0.00 57.08<br />
(69.10) (0.00) (69.10) (69.90) (0.00) (69.90) (67.90) (0.00) (67.91)<br />
Mandsaur 83.29 26.56 109.86 82.95 26.55 109.50 69.15 22.13 91.25<br />
(43.90) (14.00) (57.90) (45.30) (14.50) (59.80) (42.80) (13.70) (56.48)<br />
Ch<strong>in</strong>dwara 70.09 46.00 116.11 69.91 46.06 115.96 58.36 38.28 96.65<br />
(32.30) (21.20) (53.60) (34.00) (22.40) (56.40) (31.10) (20.40) (51.51)<br />
Rajasthan Banswara 64.65 66.06 130.73 64.67 66.01 130.67 54.01 55.06 108.96<br />
(27.50) (28.10) (55.60) (28.90) (29.50) (58.40) (25.70) (26.20) (51.85)<br />
Bhilwara 46.51 36.17 82.85 46.47 36.26 82.73 38.74 30.27 68.96<br />
(29.70) (23.10) (52.90) (31.40) (24.50) (55.90) (28.80) (22.50) (51.26)<br />
Udaipur 74.42 46.40 121.05 74.42 46.48 121.10 61.99 38.84 100.82<br />
(34.80) (21.70) (56.60) (36.50) (22.80) (59.40) (33.20) (20.80) (54.00)<br />
Uttar Pradesh Behraich 76.06 58.40 134.47 76.08 58.40 134.48 63.39 48.78 112.09<br />
(31.00) (23.80) (54.80) (32.70) (25.10) (57.80) (29.50) (22.70) (52.16)<br />
Hardoi 74.49 46.58 121.07 74.42 46.48 121.10 61.99 38.84 100.82<br />
(34.70) (21.70) (56.40) (36.50) (22.80) (59.40) (33.20) (20.80) (54.00)<br />
Bulandshar 52.11 78.93 131.05 51.91 79.06 130.96 43.27 65.80 109.22<br />
(20.60) (31.20) (51.80) (21.80) (33.20) (55.00) (19.40) (29.50) (49.00)<br />
Non-traditional maize grow<strong>in</strong>g states<br />
Andhra Pradesh Nizamabad —- ‡ —- —- —- —- —- 62.74 63.02 125.73<br />
(22.40) (22.50) (44.89)<br />
Karimnagar —- —- —- —- —- —- 70.40 46.66 117.08<br />
(34.10) (22.60) (56.71)<br />
Mahboobnagar —- —- —- —- —- —- 63.32 45.01 108.33<br />
(33.20) (23.60) (56.80)<br />
Karnataka Chitradurga —- —- —- —- —- —- 68.78 60.00 128.76<br />
(27.40) (23.90) (51.29)<br />
Dharwad —- —- —- —- —- —- 61.75 45.28 106.88<br />
(28.50) (20.90) (49.33)<br />
Belgaum —- —- —- —- —- —- 52.36 56.33 115.36<br />
(30.55) (21.20) (51.70)<br />
Source: IFAD-CIMMYT-<strong>India</strong> RRA Surveys, 2001.<br />
†<br />
Figures <strong>in</strong> parentheses <strong>in</strong>dicate % of total operational costs.<br />
‡<br />
—- = not cultivated.


