Mileage-Based User Fee Winners and Losers - RAND Corporation
Mileage-Based User Fee Winners and Losers - RAND Corporation
Mileage-Based User Fee Winners and Losers - RAND Corporation

You also want an ePaper? Increase the reach of your titles
YUMPU automatically turns print PDFs into web optimized ePapers that Google loves.
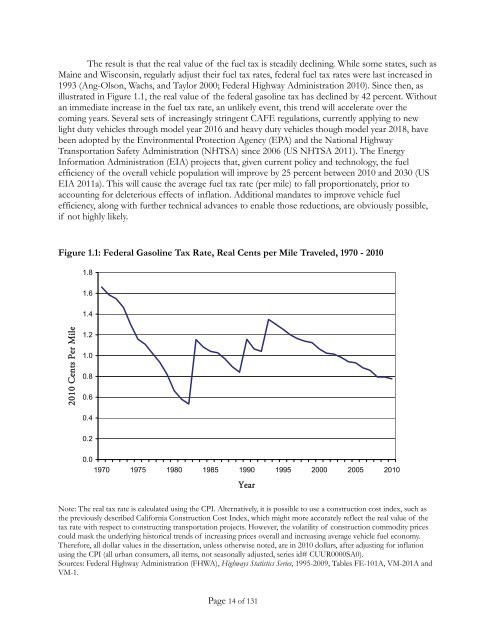
The result is that the real value of the fuel tax is steadily declining. While some states, such as<br />
Maine <strong>and</strong> Wisconsin, regularly adjust their fuel tax rates, federal fuel tax rates were last increased in<br />
1993 (Ang-Olson, Wachs, <strong>and</strong> Taylor 2000; Federal Highway Administration 2010). Since then, as<br />
illustrated in Figure 1.1, the real value of the federal gasoline tax has declined by 42 percent. Without<br />
an immediate increase in the fuel tax rate, an unlikely event, this trend will accelerate over the<br />
coming years. Several sets of increasingly stringent CAFE regulations, currently applying to new<br />
light duty vehicles through model year 2016 <strong>and</strong> heavy duty vehicles though model year 2018, have<br />
been adopted by the Environmental Protection Agency (EPA) <strong>and</strong> the National Highway<br />
Transportation Safety Administration (NHTSA) since 2006 (US NHTSA 2011). The Energy<br />
Information Administration (EIA) projects that, given current policy <strong>and</strong> technology, the fuel<br />
efficiency of the overall vehicle population will improve by 25 percent between 2010 <strong>and</strong> 2030 (US<br />
EIA 2011a). This will cause the average fuel tax rate (per mile) to fall proportionately, prior to<br />
accounting for deleterious effects of inflation. Additional m<strong>and</strong>ates to improve vehicle fuel<br />
efficiency, along with further technical advances to enable those reductions, are obviously possible,<br />
if not highly likely.<br />
Figure 1.1: Federal Gasoline Tax Rate, Real Cents per Mile Traveled, 1970 - 2010<br />
1.8<br />
1.6<br />
1.4<br />
2010 Cents Per Mile<br />
1.2<br />
1.0<br />
0.8<br />
0.6<br />
0.4<br />
0.2<br />
0.0<br />
1970 1975 1980 1985 1990 1995 2000 2005 2010<br />
Year<br />
Note: The real tax rate is calculated using the CPI. Alternatively, it is possible to use a construction cost index, such as<br />
the previously described California Construction Cost Index, which might more accurately reflect the real value of the<br />
tax rate with respect to constructing transportation projects. However, the volatility of construction commodity prices<br />
could mask the underlying historical trends of increasing prices overall <strong>and</strong> increasing average vehicle fuel economy.<br />
Therefore, all dollar values in the dissertation, unless otherwise noted, are in 2010 dollars, after adjusting for inflation<br />
using the CPI (all urban consumers, all items, not seasonally adjusted, series id# CUUR0000SA0).<br />
Sources: Federal Highway Administration (FHWA), Highways Statistics Series, 1995-2009, Tables FE-101A, VM-201A <strong>and</strong><br />
VM-1.<br />
Page 14 of 131