Mileage-Based User Fee Winners and Losers - RAND Corporation
Mileage-Based User Fee Winners and Losers - RAND Corporation
Mileage-Based User Fee Winners and Losers - RAND Corporation

Create successful ePaper yourself
Turn your PDF publications into a flip-book with our unique Google optimized e-Paper software.
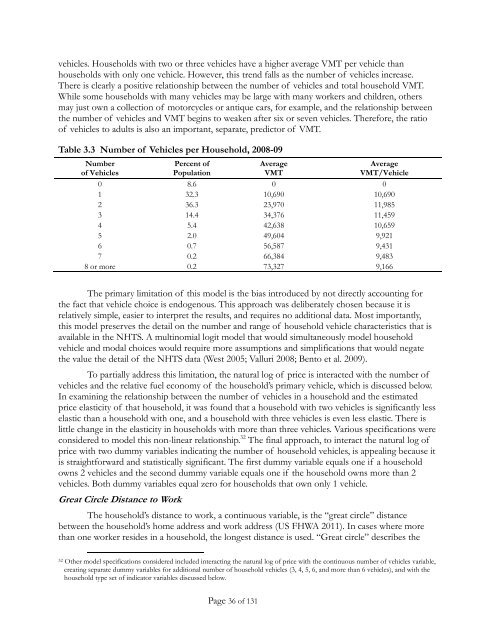
vehicles. Households with two or three vehicles have a higher average VMT per vehicle than<br />
households with only one vehicle. However, this trend falls as the number of vehicles increase.<br />
There is clearly a positive relationship between the number of vehicles <strong>and</strong> total household VMT.<br />
While some households with many vehicles may be large with many workers <strong>and</strong> children, others<br />
may just own a collection of motorcycles or antique cars, for example, <strong>and</strong> the relationship between<br />
the number of vehicles <strong>and</strong> VMT begins to weaken after six or seven vehicles. Therefore, the ratio<br />
of vehicles to adults is also an important, separate, predictor of VMT.<br />
Table 3.3 Number of Vehicles per Household, 2008-09<br />
Number<br />
of Vehicles<br />
Percent of<br />
Population<br />
Average<br />
VMT<br />
Average<br />
VMT/Vehicle<br />
0 8.6 0 0<br />
1 32.3 10,690 10,690<br />
2 36.3 23,970 11,985<br />
3 14.4 34,376 11,459<br />
4 5.4 42,638 10,659<br />
5 2.0 49,604 9,921<br />
6 0.7 56,587 9,431<br />
7 0.2 66,384 9,483<br />
8 or more 0.2 73,327 9,166<br />
The primary limitation of this model is the bias introduced by not directly accounting for<br />
the fact that vehicle choice is endogenous. This approach was deliberately chosen because it is<br />
relatively simple, easier to interpret the results, <strong>and</strong> requires no additional data. Most importantly,<br />
this model preserves the detail on the number <strong>and</strong> range of household vehicle characteristics that is<br />
available in the NHTS. A multinomial logit model that would simultaneously model household<br />
vehicle <strong>and</strong> modal choices would require more assumptions <strong>and</strong> simplifications that would negate<br />
the value the detail of the NHTS data (West 2005; Valluri 2008; Bento et al. 2009).<br />
To partially address this limitation, the natural log of price is interacted with the number of<br />
vehicles <strong>and</strong> the relative fuel economy of the household’s primary vehicle, which is discussed below.<br />
In examining the relationship between the number of vehicles in a household <strong>and</strong> the estimated<br />
price elasticity of that household, it was found that a household with two vehicles is significantly less<br />
elastic than a household with one, <strong>and</strong> a household with three vehicles is even less elastic. There is<br />
little change in the elasticity in households with more than three vehicles. Various specifications were<br />
considered to model this non-linear relationship. 32 The final approach, to interact the natural log of<br />
price with two dummy variables indicating the number of household vehicles, is appealing because it<br />
is straightforward <strong>and</strong> statistically significant. The first dummy variable equals one if a household<br />
owns 2 vehicles <strong>and</strong> the second dummy variable equals one if the household owns more than 2<br />
vehicles. Both dummy variables equal zero for households that own only 1 vehicle.<br />
Great Circle Distance to Work<br />
The household’s distance to work, a continuous variable, is the “great circle” distance<br />
between the household’s home address <strong>and</strong> work address (US FHWA 2011). In cases where more<br />
than one worker resides in a household, the longest distance is used. “Great circle” describes the<br />
32 Other model specifications considered included interacting the natural log of price with the continuous number of vehicles variable,<br />
creating separate dummy variables for additional number of household vehicles (3, 4, 5, 6, <strong>and</strong> more than 6 vehicles), <strong>and</strong> with the<br />
household type set of indicator variables discussed below.<br />
Page 36 of 131