Mileage-Based User Fee Winners and Losers - RAND Corporation
Mileage-Based User Fee Winners and Losers - RAND Corporation
Mileage-Based User Fee Winners and Losers - RAND Corporation

You also want an ePaper? Increase the reach of your titles
YUMPU automatically turns print PDFs into web optimized ePapers that Google loves.
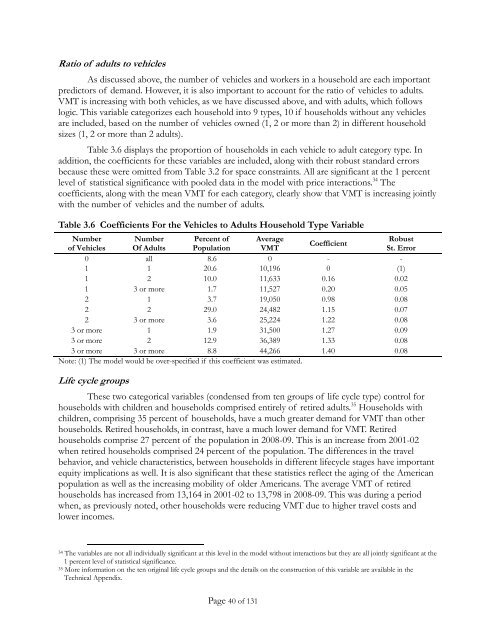
Ratio of adults to vehicles<br />
As discussed above, the number of vehicles <strong>and</strong> workers in a household are each important<br />
predictors of dem<strong>and</strong>. However, it is also important to account for the ratio of vehicles to adults.<br />
VMT is increasing with both vehicles, as we have discussed above, <strong>and</strong> with adults, which follows<br />
logic. This variable categorizes each household into 9 types, 10 if households without any vehicles<br />
are included, based on the number of vehicles owned (1, 2 or more than 2) in different household<br />
sizes (1, 2 or more than 2 adults).<br />
Table 3.6 displays the proportion of households in each vehicle to adult category type. In<br />
addition, the coefficients for these variables are included, along with their robust st<strong>and</strong>ard errors<br />
because these were omitted from Table 3.2 for space constraints. All are significant at the 1 percent<br />
level of statistical significance with pooled data in the model with price interactions. 34 The<br />
coefficients, along with the mean VMT for each category, clearly show that VMT is increasing jointly<br />
with the number of vehicles <strong>and</strong> the number of adults.<br />
Table 3.6 Coefficients For the Vehicles to Adults Household Type Variable<br />
Number Number Percent of Average<br />
Robust<br />
Coefficient<br />
of Vehicles Of Adults Population VMT<br />
St. Error<br />
0 all 8.6 0 - -<br />
1 1 20.6 10,196 0 (1)<br />
1 2 10.0 11,633 0.16 0.02<br />
1 3 or more 1.7 11,527 0.20 0.05<br />
2 1 3.7 19,050 0.98 0.08<br />
2 2 29.0 24,482 1.15 0.07<br />
2 3 or more 3.6 25,224 1.22 0.08<br />
3 or more 1 1.9 31,500 1.27 0.09<br />
3 or more 2 12.9 36,389 1.33 0.08<br />
3 or more 3 or more 8.8 44,266 1.40 0.08<br />
Note: (1) The model would be over-specified if this coefficient was estimated.<br />
Life cycle groups<br />
These two categorical variables (condensed from ten groups of life cycle type) control for<br />
households with children <strong>and</strong> households comprised entirely of retired adults. 35 Households with<br />
children, comprising 35 percent of households, have a much greater dem<strong>and</strong> for VMT than other<br />
households. Retired households, in contrast, have a much lower dem<strong>and</strong> for VMT. Retired<br />
households comprise 27 percent of the population in 2008-09. This is an increase from 2001-02<br />
when retired households comprised 24 percent of the population. The differences in the travel<br />
behavior, <strong>and</strong> vehicle characteristics, between households in different lifecycle stages have important<br />
equity implications as well. It is also significant that these statistics reflect the aging of the American<br />
population as well as the increasing mobility of older Americans. The average VMT of retired<br />
households has increased from 13,164 in 2001-02 to 13,798 in 2008-09. This was during a period<br />
when, as previously noted, other households were reducing VMT due to higher travel costs <strong>and</strong><br />
lower incomes.<br />
34 The variables are not all individually significant at this level in the model without interactions but they are all jointly significant at the<br />
1 percent level of statistical significance.<br />
35 More information on the ten original life cycle groups <strong>and</strong> the details on the construction of this variable are available in the<br />
Technical Appendix.<br />
Page 40 of 131