Mileage-Based User Fee Winners and Losers - RAND Corporation
Mileage-Based User Fee Winners and Losers - RAND Corporation
Mileage-Based User Fee Winners and Losers - RAND Corporation

You also want an ePaper? Increase the reach of your titles
YUMPU automatically turns print PDFs into web optimized ePapers that Google loves.
A growing body of research suggests that price elasticity is not constant among households<br />
(Blundell, Horowitz, <strong>and</strong> Parey 2011). Particularly relevant to this study are research demonstrating<br />
that households with lower incomes are more price elastic than households with higher incomes<br />
(Wadud, Graham, <strong>and</strong> Nol<strong>and</strong> 2009; Bento et al. 2009; West 2005). 26 This can be incorporated into<br />
the model developed here by adding a term that allows price to interact with income (Zhang et al.<br />
2009; McMullen, Zhang, <strong>and</strong> Nakahara 2010; Weatherford 2011). The price elasticity is now a<br />
function of the natural log of income <strong>and</strong> the coefficients on the natural log of price variable <strong>and</strong><br />
the interaction term. Price elasticity has also been shown to vary with other socio-economic<br />
variables <strong>and</strong> population density (Bento et al. 2009; West 2005).<br />
The model is also biased because vehicle choice is endogenous. The choices of whether to<br />
own a vehicle, what type (truck or car, for example), how many vehicles of each type to own, <strong>and</strong><br />
how much to drive each vehicle are all separate decisions that households must make. Household<br />
socioeconomics <strong>and</strong> geography predict these choices <strong>and</strong>, by not separately modeling those choices<br />
the estimates are biased. The model compounds this problem by then holding current vehicle<br />
ownership, <strong>and</strong> the proportion of household VMT per vehicle, fixed. This approach was chosen to<br />
avoid the need to make certain simplifying assumptions, discussed in greater detail later in this<br />
chapter, which would have prevented the disaggregation of households by certain socio-economic<br />
details. This modeling approach is also relatively simple, the results are easier to interpret, <strong>and</strong><br />
requires no additional data in addition to the NHTS data. However, the resulting endogeneity bias<br />
overestimates the price elasticity of dem<strong>and</strong> for VMT.<br />
To minimize this bias, the price elasticity is allowed to vary with characteristics of the<br />
household’s vehicle stock. Households that own different types of vehicles have been found to be<br />
less sensitive to changes in price (McMullen, Zhang, <strong>and</strong> Nakahara 2010; Weatherford 2011). For<br />
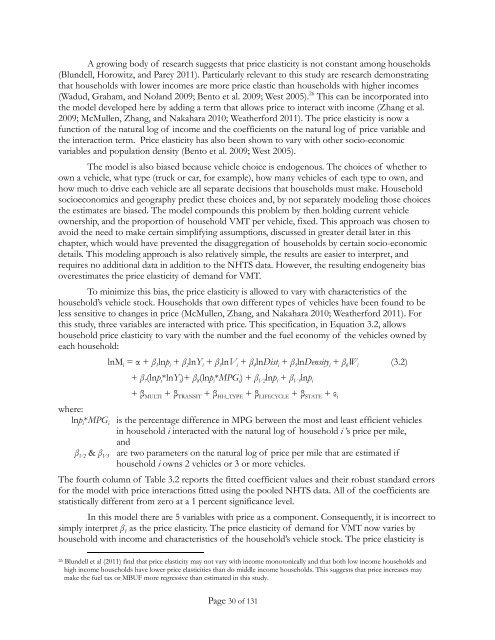
this study, three variables are interacted with price. This specification, in Equation 3.2, allows<br />
household price elasticity to vary with the number <strong>and</strong> the fuel economy of the vehicles owned by<br />
each household:<br />
lnM i = α + β 1 lnp i + β 2 lnY i + β 3 lnV i + β 4 lnDist i + β 5 lnDensity i + β 6 W i (3.2)<br />
+ β 7 (lnp i *lnY i )+ β 8 (lnp i *MPG i ) + β V2 lnp i + β V3 lnp i<br />
+ β MULTI + β TRANSIT + β HH_TYPE + β LIFECYCLE + β STATE + ε i<br />
where:<br />
lnp i *MPG i is the percentage difference in MPG between the most <strong>and</strong> least efficient vehicles<br />
in household i interacted with the natural log of household i ’s price per mile,<br />
<strong>and</strong><br />
β V2 & β V3 are two parameters on the natural log of price per mile that are estimated if<br />
household i owns 2 vehicles or 3 or more vehicles.<br />
The fourth column of Table 3.2 reports the fitted coefficient values <strong>and</strong> their robust st<strong>and</strong>ard errors<br />
for the model with price interactions fitted using the pooled NHTS data. All of the coefficients are<br />
statistically different from zero at a 1 percent significance level.<br />
In this model there are 5 variables with price as a component. Consequently, it is incorrect to<br />
simply interpret β 1 as the price elasticity. The price elasticity of dem<strong>and</strong> for VMT now varies by<br />
household with income <strong>and</strong> characteristics of the household’s vehicle stock. The price elasticity is<br />
26 Blundell et al (2011) find that price elasticity may not vary with income monotonically <strong>and</strong> that both low income households <strong>and</strong><br />
high income households have lower price elasticities than do middle income households. This suggests that price increases may<br />
make the fuel tax or MBUF more regressive than estimated in this study.<br />
Page 30 of 131