Mileage-Based User Fee Winners and Losers - RAND Corporation
Mileage-Based User Fee Winners and Losers - RAND Corporation
Mileage-Based User Fee Winners and Losers - RAND Corporation
Create successful ePaper yourself
Turn your PDF publications into a flip-book with our unique Google optimized e-Paper software.
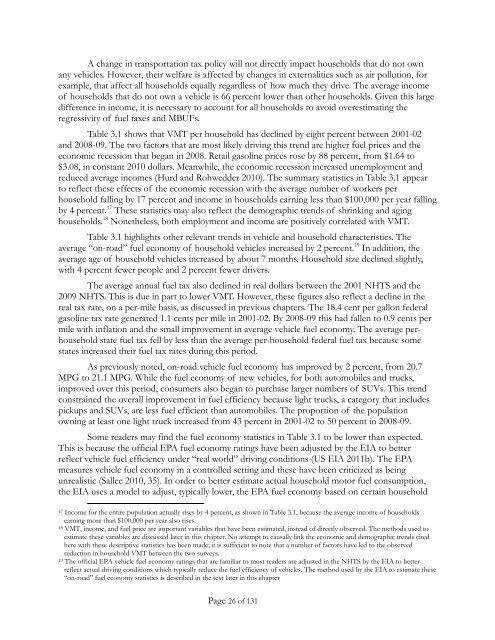
A change in transportation tax policy will not directly impact households that do not own<br />
any vehicles. However, their welfare is affected by changes in externalities such as air pollution, for<br />
example, that affect all households equally regardless of how much they drive. The average income<br />
of households that do not own a vehicle is 66 percent lower than other households. Given this large<br />
difference in income, it is necessary to account for all households to avoid overestimating the<br />
regressivity of fuel taxes <strong>and</strong> MBUFs.<br />
Table 3.1 shows that VMT per household has declined by eight percent between 2001-02<br />
<strong>and</strong> 2008-09. The two factors that are most likely driving this trend are higher fuel prices <strong>and</strong> the<br />
economic recession that began in 2008. Retail gasoline prices rose by 88 percent, from $1.64 to<br />
$3.08, in constant 2010 dollars. Meanwhile, the economic recession increased unemployment <strong>and</strong><br />
reduced average incomes (Hurd <strong>and</strong> Rohwedder 2010). The summary statistics in Table 3.1 appear<br />
to reflect these effects of the economic recession with the average number of workers per<br />
household falling by 17 percent <strong>and</strong> income in households earning less than $100,000 per year falling<br />
by 4 percent. 17 These statistics may also reflect the demographic trends of shrinking <strong>and</strong> aging<br />
households. 18 Nonetheless, both employment <strong>and</strong> income are positively correlated with VMT.<br />
Table 3.1 highlights other relevant trends in vehicle <strong>and</strong> household characteristics. The<br />
average “on-road” fuel economy of household vehicles increased by 2 percent. 19 In addition, the<br />
average age of household vehicles increased by about 7 months. Household size declined slightly,<br />
with 4 percent fewer people <strong>and</strong> 2 percent fewer drivers.<br />
The average annual fuel tax also declined in real dollars between the 2001 NHTS <strong>and</strong> the<br />
2009 NHTS. This is due in part to lower VMT. However, these figures also reflect a decline in the<br />
real tax rate, on a per-mile basis, as discussed in previous chapters. The 18.4 cent per gallon federal<br />
gasoline tax rate generated 1.1 cents per mile in 2001-02. By 2008-09 this had fallen to 0.9 cents per<br />
mile with inflation <strong>and</strong> the small improvement in average vehicle fuel economy. The average perhousehold<br />
state fuel tax fell by less than the average per-household federal fuel tax because some<br />
states increased their fuel tax rates during this period.<br />
As previously noted, on-road vehicle fuel economy has improved by 2 percent, from 20.7<br />
MPG to 21.1 MPG. While the fuel economy of new vehicles, for both automobiles <strong>and</strong> trucks,<br />
improved over this period, consumers also began to purchase larger numbers of SUVs. This trend<br />
constrained the overall improvement in fuel efficiency because light trucks, a category that includes<br />
pickups <strong>and</strong> SUVs, are less fuel efficient than automobiles. The proportion of the population<br />
owning at least one light truck increased from 43 percent in 2001-02 to 50 percent in 2008-09.<br />
Some readers may find the fuel economy statistics in Table 3.1 to be lower than expected.<br />
This is because the official EPA fuel economy ratings have been adjusted by the EIA to better<br />
reflect vehicle fuel efficiency under “real world” driving conditions (US EIA 2011b). The EPA<br />
measures vehicle fuel economy in a controlled setting <strong>and</strong> these have been criticized as being<br />
unrealistic (Sallee 2010, 35). In order to better estimate actual household motor fuel consumption,<br />
the EIA uses a model to adjust, typically lower, the EPA fuel economy based on certain household<br />
17 Income for the entire population actually rises by 4 percent, as shown in Table 3.1, because the average income of households<br />
earning more than $100,000 per year also rises.<br />
18 VMT, income, <strong>and</strong> fuel price are important variables that have been estimated, instead of directly observed. The methods used to<br />
estimate these variables are discussed later in this chapter. No attempt to causally link the economic <strong>and</strong> demographic trends cited<br />
here with these descriptive statistics has been made; it is sufficient to note that a number of factors have led to the observed<br />
reduction in household VMT between the two surveys.<br />
19 The official EPA vehicle fuel economy ratings that are familiar to most readers are adjusted in the NHTS by the EIA to better<br />
reflect actual driving conditions which typically reduce the fuel efficiency of vehicles. The method used by the EIA to estimate these<br />
“on-road” fuel economy statistics is described in the text later in this chapter<br />
Page 26 of 131


