Mileage-Based User Fee Winners and Losers - RAND Corporation
Mileage-Based User Fee Winners and Losers - RAND Corporation
Mileage-Based User Fee Winners and Losers - RAND Corporation

You also want an ePaper? Increase the reach of your titles
YUMPU automatically turns print PDFs into web optimized ePapers that Google loves.
MPG Difference between Household’s Most <strong>and</strong> Least Efficient Vehicles<br />
In this model, households are not allowed to change the number or type of vehicles owned<br />
<strong>and</strong> how much these are driven in response to changes in tax policy. Further, in households owning<br />
more than one vehicle, the share of annual VMT per vehicle is held constant. These are very strong<br />
assumptions made to simplify the model that may or may not be reasonable. In fact, they may be<br />
reasonable assumptions given the relatively small change in the price per mile for most households<br />
for most of the alternatives. Households with more than one vehicle do have more short-run<br />
flexibility that other households do not have <strong>and</strong> may be less sensitive to changes in price. It was<br />
previously demonstrated that households with more than one vehicle have lower price elasticity. This<br />
variable shows that households with vehicles of various fuel efficiencies have a “substitute” that<br />
allows them to be less sensitive to changes in price because they can switch some driving to other<br />
vehicles should the price increase or, for that matter, decrease. Instead of explicitly modeling how<br />
much each household chooses to drive each vehicle, this model uses an interaction term to allow the<br />
price elasticity to vary.<br />
In previous research, a dummy variable has been used to indicate whether a household owns<br />
a “substitute” vehicle. This variable is set equal to one if a household owns more than one type of<br />
vehicle, for example an SUV <strong>and</strong> a pickup. This dummy variable is interacted with price <strong>and</strong> has the<br />
effect of reducing the price elasticity of dem<strong>and</strong> (McMullen, Zhang, <strong>and</strong> Nakahara 2010). While<br />
multiple types of vehicles are positively correlated with VMT, the interaction term is not statistically<br />
significant in McMullen, Zhang, <strong>and</strong> Nakahara (2010). This may be because the type of vehicle is<br />
not a very good predictor of MPG; there are fuel efficient small pickups <strong>and</strong> fuel inefficient sports<br />
cars, for example. The range of fuel efficiency is particularly large among automobiles. Therefore a<br />
household can have a legitimate MPG substitute with two cars while another that owns a van <strong>and</strong> a<br />
SUV may not have a legitimate MPG substitute.<br />
Weatherford (2011) proposes an improvement to this approach by introducing a second<br />
dummy variable indicating whether or not a household owns two or more vehicles where the MPG<br />
of one of the vehicles is 20 percent or more fuel efficient than the average MPG of the household.<br />
This variable more clearly indicates whether or not the household has a vehicle that is more, or less,<br />
fuel efficient than the others owned by the household, regardless of type. It is problematic, however,<br />
in that the 20 percent threshold is arbitrary.<br />
This study introduces a continuous alternative to the MPG “substitute” variable in using the<br />
percentage difference between the most fuel efficient <strong>and</strong> the least fuel efficient vehicle in the<br />
household. This household MPG range variable addresses both of the concerns raised above <strong>and</strong><br />
indicates not only whether a household owns a vehicle that is a “substitute” based entirely on MPG<br />
criteria, but also captures how good a substitute that vehicle is. Because the price elasticity works in<br />
both directions, it is important to use a variable for which the coefficient will always have the same<br />
sign.<br />
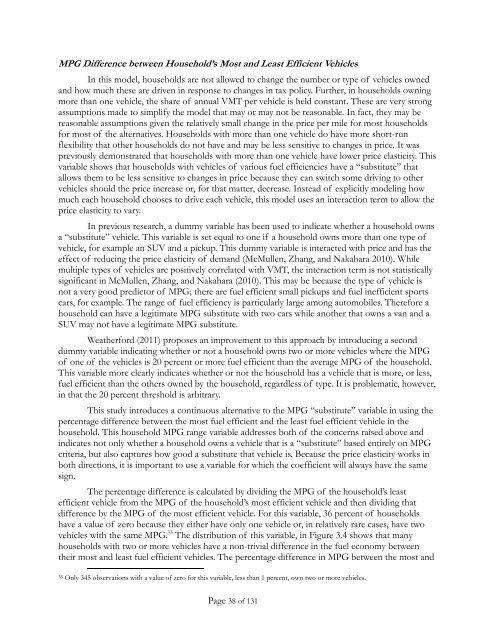
The percentage difference is calculated by dividing the MPG of the household’s least<br />
efficient vehicle from the MPG of the household’s most efficient vehicle <strong>and</strong> then dividing that<br />
difference by the MPG of the most efficient vehicle. For this variable, 36 percent of households<br />
have a value of zero because they either have only one vehicle or, in relatively rare cases, have two<br />
vehicles with the same MPG. 33 The distribution of this variable, in Figure 3.4 shows that many<br />
households with two or more vehicles have a non-trivial difference in the fuel economy between<br />
their most <strong>and</strong> least fuel efficient vehicles. The percentage difference in MPG between the most <strong>and</strong><br />
33 Only 345 observations with a value of zero for this variable, less than 1 percent, own two or more vehicles.<br />
Page 38 of 131