

john-lewis-partnership-plc-annual-report-2015
john-lewis-partnership-plc-annual-report-2015
john-lewis-partnership-plc-annual-report-2015

Create successful ePaper yourself
Turn your PDF publications into a flip-book with our unique Google optimized e-Paper software.
58<br />
John Lewis Partnership <strong>plc</strong> Annual Report and Accounts <strong>2015</strong><br />
Partnership performance (continued)<br />
ENVIRONMENT review<br />
The Partnership’s approach to<br />
the environment is outlined in<br />
the Constitution in rule 109 to<br />
“take all reasonable steps to<br />
minimise any detrimental effect<br />
its operations may have on the<br />
environment, and to promote good<br />
environmental practice”.<br />
The challenges we face<br />
The issue of climate change should be a primary<br />
concern for all businesses. For the Partnership,<br />
it matters both in terms of how we minimise<br />
our impact on the environment, and how the<br />
effects of climate change will impact us in the<br />
future. We need to take action so that we<br />
can carry on growing, while minimising our<br />
direct negative environmental impacts and<br />
continuing to ensure we source products from<br />
environmentally sustainable sources.<br />
Our Carbon Plan<br />
The biggest contributor to our operational<br />
carbon footprint is the energy we use in our<br />
estate. In 2010 we published our Carbon Plan<br />
with an absolute operational emission target of<br />
15% CO 2e reduction. This is an exceptionally<br />
challenging target in particular with our current<br />
level of growth being a 33% increase in sales<br />
since 2010. In addition we recognise the changes<br />
in global carbon <strong>report</strong>ing coming into effect<br />
in <strong>2015</strong> will have a material effect on the way<br />
we <strong>report</strong> our carbon footprint. During 2014<br />
we have also gained valuable insight on the<br />
application and viability of on-site renewable<br />
energy technologies which have proved<br />
very challenging.<br />
We are therefore reviewing our future Carbon<br />
Plan targets in line with the Partnership’s<br />
projected growth rate, the balance of that<br />
growth to be delivered between new shops<br />
and online, the change in <strong>report</strong>ing guidance<br />
and the availability of viable on site renewable<br />
technology. We will ensure that these changes<br />
do not deter from the Partnership’s goal of<br />
reducing our environmental impact.<br />
In 2014 we have continued to innovate and<br />
develop technologies that help make us more<br />
efficient. This has included building two new<br />
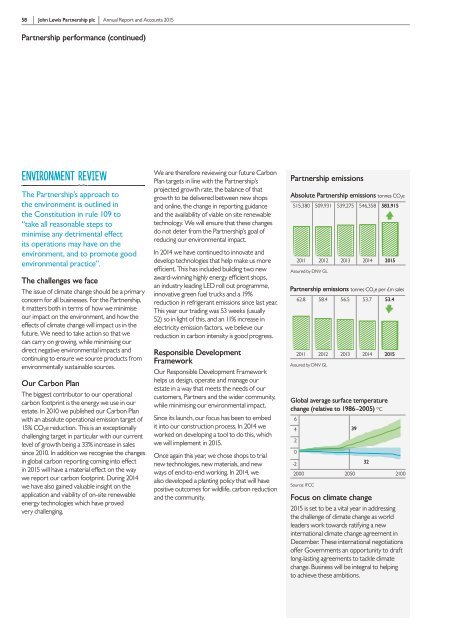
Partnership emissions<br />
award-winning highly energy efficient shops,<br />
an<br />
Absolute<br />
industry leading<br />
Partnership<br />
LED roll<br />
emissions<br />
out programme,<br />
tonnes CO 2 e<br />
innovative green fuel trucks and a 19%<br />
515,380 509,931 539,275 546,358 583,915<br />
reduction in refrigerant emissions since last year.<br />
This year our trading was 53 weeks (usually<br />
52) so in light of this, and an 11% increase in<br />
electricity emission factors, we believe our<br />
reduction in carbon intensity is good progress.<br />
Responsible 2011 2012Development<br />
2013 2014 <strong>2015</strong><br />
Framework<br />
Assured by DNV GL<br />
Our Responsible Development Framework<br />
helps us design, operate and manage our<br />
estate in a way that meets the needs of our<br />
customers, Partners and the wider community,<br />
while Transport minimising emissions our environmental impact.<br />
Since Transport its launch, emissions our focus tonnes has been CO 2 e to per embed £m sales<br />
it into our construction process. In 2014 we<br />
8.8 8.7 8.4 8.4 8.5<br />
worked on developing a tool to do this, which<br />
we will implement in <strong>2015</strong>.<br />
Once again this year, we chose shops to trial<br />
new technologies, new materials, and new<br />
ways of end-to-end working. In 2014, we<br />
also developed a planting policy that will have<br />
2011 2012 2013 2014 <strong>2015</strong><br />
positive outcomes for wildlife, carbon reduction<br />
and Assured the by community.<br />
DNV GL<br />
Partnership emissions<br />
Absolute Partnership emissions tonnes CO 2 e<br />
515,380 509,931 539,275 546,358 583,915<br />
2011 2012 2013 2014 <strong>2015</strong><br />
Assured by DNV GL<br />
Partnership emissions tonnes CO 2 e per £m sales<br />
62.8 58.4 56.5 53.7 53.4<br />
Transport emissions<br />
Transport emissions tonnes CO 2 e per £m sales<br />
8.8 8.7 8.4 8.4 8.5<br />
2011 2012 2013 2014 <strong>2015</strong><br />
Assured by DNV GL<br />
2011 2012 2013 2014 <strong>2015</strong><br />
Waste<br />
Assured Global by average diverted from landfill<br />
DNV GL surface temperature<br />
change (relative to 1986–2005)<br />
Proportion of Partnership waste<br />
O C<br />
diverted 6 from landfill %<br />
480.8 89.0 92.1<br />
39<br />
96.1 96.5<br />
2<br />
0<br />
-2<br />
32<br />
2000 2050 2100<br />
Source: 2011 IFCC 2012 2013 2014 <strong>2015</strong><br />
Assured<br />
Focus<br />
by DNV<br />
on<br />
GL<br />
climate change<br />
<strong>2015</strong> is set to be a vital year in addressing<br />
the challenge of climate change as world<br />
leaders work towards ratifying a new<br />
international climate change agreement in<br />
December. These international negotiations<br />
offer Governments an opportunity to draft<br />
long-lasting agreements to tackle climate<br />
change. Business will be integral to helping<br />
to achieve these ambitions.<br />
Partnership<br />
62.8 5<br />
2011 2<br />
Assured by DNV<br />
Waste di<br />
Proportion<br />
diverted fro<br />
80.8 8<br />
2011 2<br />
Assured by DNV