

john-lewis-partnership-plc-annual-report-2015
john-lewis-partnership-plc-annual-report-2015
john-lewis-partnership-plc-annual-report-2015

You also want an ePaper? Increase the reach of your titles
YUMPU automatically turns print PDFs into web optimized ePapers that Google loves.
62<br />
John Lewis Partnership <strong>plc</strong> Annual Report and Accounts <strong>2015</strong><br />
Waitrose performance (continued)<br />
FINANCIAL review<br />
Gross sales for the year grew by<br />
6.5% to £6.51bn (4.6% on a 52 week<br />
basis), with like-for-like sales up 1.4%.<br />
On average, we had 400,000 more<br />
customer transactions a week<br />
compared to last year, and our market<br />
share grew to 5.4% (Kantar).<br />
Operating profit was down by 23.4% to<br />
£237.4m (down 24.4% on a 52 week basis).<br />
This was held back by a significantly higher<br />
level of investment in the year in new branches<br />
and IT resilience, and the impact of one-off<br />
items. The year-on-year impact on our profits<br />
from these factors was approximately £30m<br />
and £27m respectively. The remaining profit<br />
decline of £26m, after excluding property<br />
profits, is primarily the impact of trading in a<br />
highly competitive and deflationary market.<br />
One-off items include property impairments<br />
and onerous lease costs (£16m), and costs<br />
associated with the planned closure of our<br />
Acton dotcom fulfilment centre (£4m).<br />
In 2014/15, we opened 13 new core branches<br />
(including eight acquired from the Cooperative)<br />
and another 20 convenience shops.<br />
The launch costs associated with this opening<br />
programme and the expected lower returns<br />
from new space in the early months both<br />
impacted profit this year.<br />
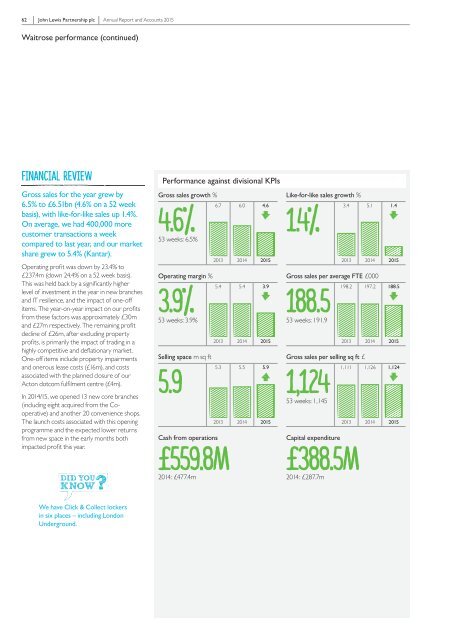
Performance against divisional KPIs<br />
Gross sales growth %<br />
4.6%<br />
6.7 6.0 4.6<br />
53 weeks: 6.5%<br />
Operating margin %<br />
3.9%<br />
5.4 5.4 3.9<br />
53 weeks: 3.9%<br />
Selling space m sq ft<br />
5.9<br />
Cash from operations<br />
£559.8m<br />
2014: £477.4m<br />
2013 2014 <strong>2015</strong><br />
2013 2014 <strong>2015</strong><br />
5.3 5.5 5.9<br />
2013 2014 <strong>2015</strong><br />
Like-for-like sales growth %<br />
1.4%<br />
3.4 5.1 1.4<br />
2013 2014 <strong>2015</strong><br />
Gross sales per average FTE £000<br />
188.5<br />
198.2 197.2 188.5<br />
53 weeks: 191.9<br />
Gross sales per selling sq ft £<br />
1,124<br />
1,111 1,126 1,124<br />
53 weeks: 1,145<br />
Capital expenditure<br />
£388.5m<br />
2014: £287.7m<br />
2013 2014 <strong>2015</strong><br />
2013 2014 <strong>2015</strong><br />
We have Click & Collect lockers<br />
in six places – including London<br />
Underground.