Aerial and Acoustic Surveys for Mackerel - BioSonics, Inc
Aerial and Acoustic Surveys for Mackerel - BioSonics, Inc
Aerial and Acoustic Surveys for Mackerel - BioSonics, Inc

Create successful ePaper yourself
Turn your PDF publications into a flip-book with our unique Google optimized e-Paper software.
In June, mackerel stock distribution was governed by hydrological conditions in the region (Figure 5.1.2.2). Small<br />
schools were found at depths 10 to 25 m in Eastern <strong>and</strong> South-Eastern part of the research area. Temperature of the<br />
water in above areas was higher than 9°C. In the Western part of the research area, where isothermal line of 9°C was<br />
very close to the surface, echograms from echo-sounder, showed no or very small number of mackerel schools.<br />
Measured Nautical Area Scattering Coefficients (S A ) <strong>for</strong> 5 mile intervals varied from 1 to 30 (m 2 /nmi 2 ). Maximal<br />
mackerel schools were registered in position 65°45’N, 4°W. Low NASCs resulted from the fact that most of the fish<br />
avoided the vessel. There<strong>for</strong>e, acoustic estimation of mackerel was not calculated.<br />
The trawl method was used <strong>for</strong> estimating the biomass <strong>and</strong> distribution of mackerel schools. During the survey, the<br />
vessel made a total of 31 trawl hauls. Mean length of fish <strong>and</strong> mean weight of mackerel were 36.06 cm, 526 g<br />
accordingly. A preliminary result gave a biomass estimate of 720 000 tones.<br />
During the survey, the RV “Smolensk” worked in conjunction with the research aircraft under the joint program (see<br />
above).<br />
69°<br />
108 109 110<br />
148 149 150 151<br />
68°<br />
113<br />
155<br />
112<br />
154<br />
153<br />
111<br />
152<br />
114 115 116117<br />
156 157 158 159 160 161 162 163 164 165 166<br />
67°<br />
173<br />
172<br />
121<br />
171<br />
170<br />
120<br />
169<br />
119<br />
168<br />
118<br />
167<br />
122 123 124 125<br />
174 175 176 177 178<br />
129<br />
128<br />
127<br />
126<br />
66°<br />
184<br />
183<br />
182<br />
181<br />
180<br />
179<br />
130 131 132 133<br />
185 186 187 188 189 190 191 192 193<br />
135<br />
134<br />
197<br />
136<br />
196<br />
195<br />
194<br />
65°<br />
137 138<br />
198 199<br />
- CTD<br />
- Ï åë. òðàë<br />
64°<br />
-8° -6° -4° -2° 0° 2° 4°<br />
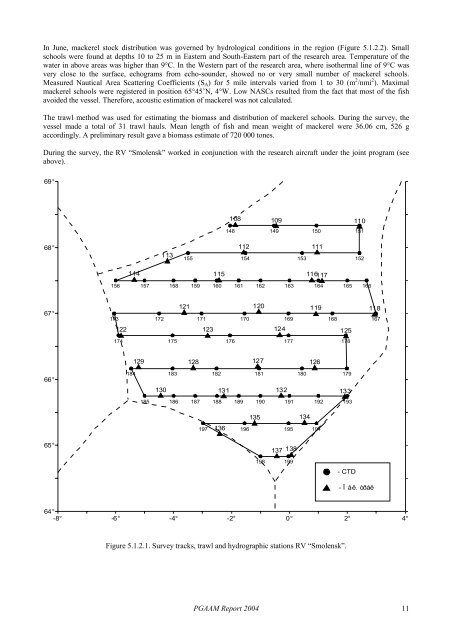
Figure 5.1.2.1. Survey tracks, trawl <strong>and</strong> hydrographic stations RV “Smolensk”.<br />
PGAAM Report 2004 11