Aerial and Acoustic Surveys for Mackerel - BioSonics, Inc
Aerial and Acoustic Surveys for Mackerel - BioSonics, Inc
Aerial and Acoustic Surveys for Mackerel - BioSonics, Inc

You also want an ePaper? Increase the reach of your titles
YUMPU automatically turns print PDFs into web optimized ePapers that Google loves.
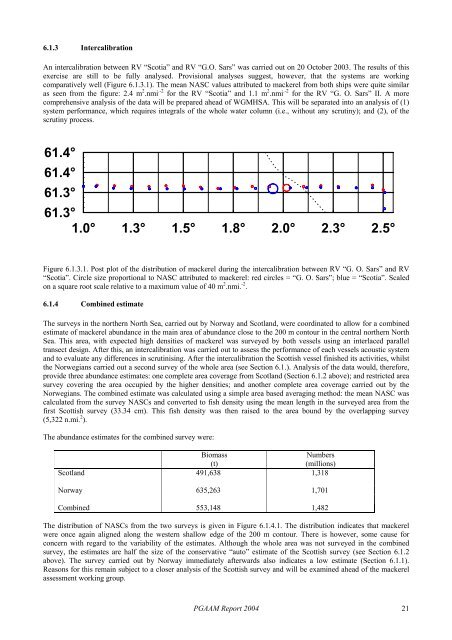
6.1.3 Intercalibration<br />
An intercalibration between RV “Scotia” <strong>and</strong> RV “G.O. Sars” was carried out on 20 October 2003. The results of this<br />
exercise are still to be fully analysed. Provisional analyses suggest, however, that the systems are working<br />
comparatively well (Figure 6.1.3.1). The mean NASC values attributed to mackerel from both ships were quite similar<br />
as seen from the figure: 2.4 m 2 .nmi .-2 <strong>for</strong> the RV “Scotia” <strong>and</strong> 1.1 m 2 .nmi .-2 <strong>for</strong> the RV “G. O. Sars” II. A more<br />
comprehensive analysis of the data will be prepared ahead of WGMHSA. This will be separated into an analysis of (1)<br />
system per<strong>for</strong>mance, which requires integrals of the whole water column (i.e., without any scrutiny); <strong>and</strong> (2), of the<br />
scrutiny process.<br />
61.4°<br />
61.4°<br />
61.3°<br />
61.3°<br />
1.0° 1.3° 1.5° 1.8° 2.0° 2.3° 2.5°<br />
Figure 6.1.3.1. Post plot of the distribution of mackerel during the intercalibration between RV “G. O. Sars” <strong>and</strong> RV<br />
“Scotia”. Circle size proportional to NASC attributed to mackerel: red circles = “G. O. Sars”; blue = “Scotia”. Scaled<br />
on a square root scale relative to a maximum value of 40 m 2 .nmi. -2 .<br />
6.1.4 Combined estimate<br />
The surveys in the northern North Sea, carried out by Norway <strong>and</strong> Scotl<strong>and</strong>, were coordinated to allow <strong>for</strong> a combined<br />
estimate of mackerel abundance in the main area of abundance close to the 200 m contour in the central northern North<br />
Sea. This area, with expected high densities of mackerel was surveyed by both vessels using an interlaced parallel<br />
transect design. After this, an intercalibration was carried out to assess the per<strong>for</strong>mance of each vessels acoustic system<br />
<strong>and</strong> to evaluate any differences in scrutinising. After the intercalibration the Scottish vessel finished its activities, whilst<br />
the Norwegians carried out a second survey of the whole area (see Section 6.1.). Analysis of the data would, there<strong>for</strong>e,<br />
provide three abundance estimates: one complete area coverage from Scotl<strong>and</strong> (Section 6.1.2 above); <strong>and</strong> restricted area<br />
survey covering the area occupied by the higher densities; <strong>and</strong> another complete area coverage carried out by the<br />
Norwegians. The combined estimate was calculated using a simple area based averaging method: the mean NASC was<br />
calculated from the survey NASCs <strong>and</strong> converted to fish density using the mean length in the surveyed area from the<br />
first Scottish survey (33.34 cm). This fish density was then raised to the area bound by the overlapping survey<br />
(5,322 n.mi. 2 ).<br />
The abundance estimates <strong>for</strong> the combined survey were:<br />
Biomass<br />
Numbers<br />
(t)<br />
(millions)<br />
Scotl<strong>and</strong> 491,638 1,318<br />
Norway 635,263 1,701<br />
Combined 553,148 1,482<br />
The distribution of NASCs from the two surveys is given in Figure 6.1.4.1. The distribution indicates that mackerel<br />
were once again aligned along the western shallow edge of the 200 m contour. There is however, some cause <strong>for</strong><br />
concern with regard to the variability of the estimates. Although the whole area was not surveyed in the combined<br />
survey, the estimates are half the size of the conservative “auto” estimate of the Scottish survey (see Section 6.1.2<br />
above). The survey carried out by Norway immediately afterwards also indicates a low estimate (Section 6.1.1).<br />
Reasons <strong>for</strong> this remain subject to a closer analysis of the Scottish survey <strong>and</strong> will be examined ahead of the mackerel<br />
assessment working group.<br />
PGAAM Report 2004 21