Aerial and Acoustic Surveys for Mackerel - BioSonics, Inc
Aerial and Acoustic Surveys for Mackerel - BioSonics, Inc
Aerial and Acoustic Surveys for Mackerel - BioSonics, Inc

You also want an ePaper? Increase the reach of your titles
YUMPU automatically turns print PDFs into web optimized ePapers that Google loves.
62°<br />
489<br />
61°<br />
508<br />
492<br />
491<br />
507<br />
493<br />
506<br />
495<br />
499<br />
497 498<br />
496<br />
60°<br />
494<br />
500<br />
488<br />
503<br />
502<br />
501<br />
505<br />
59°<br />
-2° -1° 0° 1° 2° 3° 4° 5°<br />
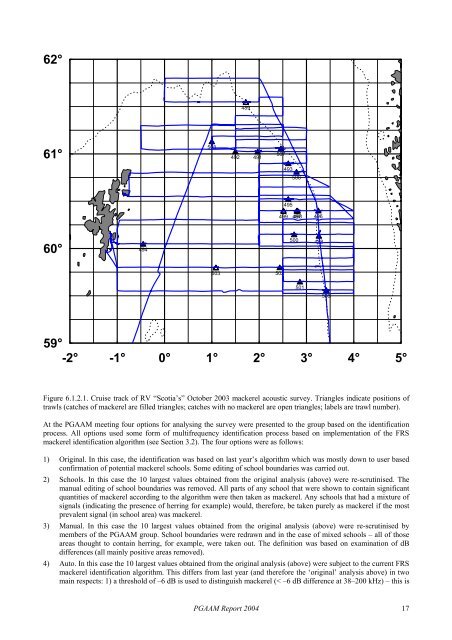
Figure 6.1.2.1. Cruise track of RV “Scotia’s” October 2003 mackerel acoustic survey. Triangles indicate positions of<br />
trawls (catches of mackerel are filled triangles; catches with no mackerel are open triangles; labels are trawl number).<br />
At the PGAAM meeting four options <strong>for</strong> analysing the survey were presented to the group based on the identification<br />
process. All options used some <strong>for</strong>m of multifrequency identification process based on implementation of the FRS<br />
mackerel identification algorithm (see Section 3.2). The four options were as follows:<br />
1) Original. In this case, the identification was based on last year’s algorithm which was mostly down to user based<br />
confirmation of potential mackerel schools. Some editing of school boundaries was carried out.<br />
2) Schools. In this case the 10 largest values obtained from the original analysis (above) were re-scrutinised. The<br />
manual editing of school boundaries was removed. All parts of any school that were shown to contain significant<br />
quantities of mackerel according to the algorithm were then taken as mackerel. Any schools that had a mixture of<br />
signals (indicating the presence of herring <strong>for</strong> example) would, there<strong>for</strong>e, be taken purely as mackerel if the most<br />
prevalent signal (in school area) was mackerel.<br />
3) Manual. In this case the 10 largest values obtained from the original analysis (above) were re-scrutinised by<br />
members of the PGAAM group. School boundaries were redrawn <strong>and</strong> in the case of mixed schools – all of those<br />
areas thought to contain herring, <strong>for</strong> example, were taken out. The definition was based on examination of dB<br />
differences (all mainly positive areas removed).<br />
4) Auto. In this case the 10 largest values obtained from the original analysis (above) were subject to the current FRS<br />
mackerel identification algorithm. This differs from last year (<strong>and</strong> there<strong>for</strong>e the ‘original’ analysis above) in two<br />
main respects: 1) a threshold of –6 dB is used to distinguish mackerel (< –6 dB difference at 38–200 kHz) – this is<br />
PGAAM Report 2004 17