Aerial and Acoustic Surveys for Mackerel - BioSonics, Inc
Aerial and Acoustic Surveys for Mackerel - BioSonics, Inc
Aerial and Acoustic Surveys for Mackerel - BioSonics, Inc

You also want an ePaper? Increase the reach of your titles
YUMPU automatically turns print PDFs into web optimized ePapers that Google loves.
NASC (m2.nm-2)<br />
1600<br />
1400<br />
1200<br />
1000<br />
800<br />
600<br />
400<br />
200<br />
0<br />
1 2 3 4 5 6 7 8 9 10<br />
EDSU<br />
test1 original<br />
test2 schools<br />
test3 manual<br />
test4 auto<br />
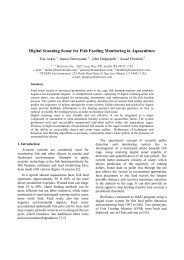
Figure 6.1.2.3. Plots of the Nautical Area Scattering Coefficients (NASCs) obtained using the four scrutiny options<br />
described in the text <strong>for</strong> the 10 Equivalent Distance Sampling Units (EDSUs) with the largest NASC values in the<br />
survey.<br />
62°<br />
61°<br />
60°<br />
59°<br />
-2° -1° 0° 1° 2° 3° 4° 5°<br />
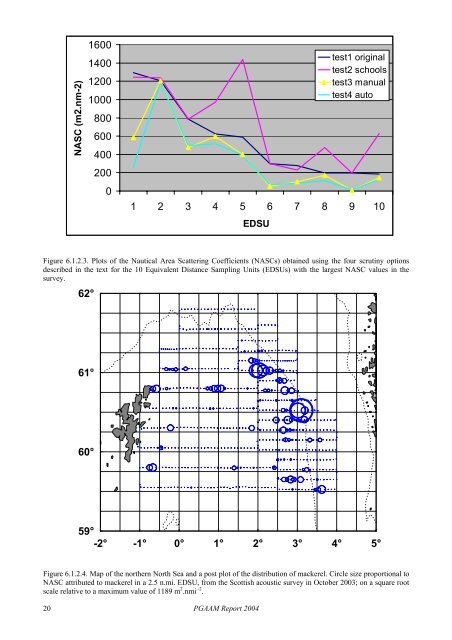
Figure 6.1.2.4. Map of the northern North Sea <strong>and</strong> a post plot of the distribution of mackerel. Circle size proportional to<br />
NASC attributed to mackerel in a 2.5 n.mi. EDSU, from the Scottish acoustic survey in October 2003; on a square root<br />
scale relative to a maximum value of 1189 m 2 .nmi .-2 .<br />
20<br />
PGAAM Report 2004