D5 Annex report WP 7: ETISDatabase methodology ... - ETIS plus
D5 Annex report WP 7: ETISDatabase methodology ... - ETIS plus
D5 Annex report WP 7: ETISDatabase methodology ... - ETIS plus

You also want an ePaper? Increase the reach of your titles
YUMPU automatically turns print PDFs into web optimized ePapers that Google loves.
<strong>D5</strong> <strong>Annex</strong> <strong>WP</strong> 7: <strong>ETIS</strong> DATABASE METHODOLOGY AND DATABASE USER<br />
MANUAL – PASSENGER TRANSPORT SUPPLY<br />
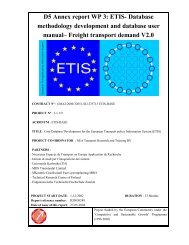
The <strong>methodology</strong> for the generation of regression functions for passenger rail tariffs is depicted<br />
by Figure 4.5.<br />
Figure 4.5<br />
Methodology for the generation of regression functions for passenger rail<br />
tariffs<br />
Supply<br />
segments<br />
X<br />
Demand<br />
segments<br />
Regression<br />
functions per<br />
crosssegment<br />
Sample relations for<br />
attaining the regression<br />
functions<br />
Tariffs<br />
Distances<br />
(timetables, Internet)<br />
Querys<br />
Internet websites of European railway companies<br />
The analyses reveal significant differences between the tariff schemes in different European<br />
countries, not only in terms of general level of prices for rail tickets, but also in terms of<br />
applicability of the demand and supply segments defined. Several countries do not have any<br />
highspeed rail services, some countries have a common tariff system for all train types, so that<br />
the only tariff determinant – apart from the distance traveled – is the wagon class used.<br />
The following figures (combined in Figure 4.6) illustrate the type of output resulting from the<br />
<strong>methodology</strong> applied. The illustrations refer to Spain and represent the tariffs differentiated by<br />
supply segments for the demand segments business and private.<br />
R20040089.doc<br />
27 May 2004 29