D5 Annex report WP 7: ETISDatabase methodology ... - ETIS plus
D5 Annex report WP 7: ETISDatabase methodology ... - ETIS plus
D5 Annex report WP 7: ETISDatabase methodology ... - ETIS plus

Create successful ePaper yourself
Turn your PDF publications into a flip-book with our unique Google optimized e-Paper software.
<strong>D5</strong> <strong>Annex</strong> <strong>WP</strong> 7: <strong>ETIS</strong> DATABASE METHODOLOGY AND DATABASE USER<br />
MANUAL – PASSENGER TRANSPORT SUPPLY<br />
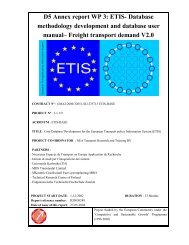
The testing phase has been performed for following countries: Germany, France, Italy and<br />
Poland. The <strong>methodology</strong> for the testing phase relating to passenger rail tariffs is illustrated by<br />
Figure 6.1.<br />
Figure 6.1<br />
Methodology for the <strong>ETIS</strong> testing phase<br />
Supply<br />
segments<br />
X<br />
Demand<br />
segments<br />
Application of<br />
attained<br />
regression<br />
functions<br />
<strong>ETIS</strong> testing phase<br />
for passenger rail tariffs<br />
Sample relations for testing phase<br />
Modelled<br />
tariffs<br />
Real<br />
tariffs<br />
Sample relations for<br />
attaining the regression<br />
functions<br />
Tariffs<br />
Regression<br />
functions per<br />
crosssegment<br />
Distances<br />
(timetables, Internet)<br />
TENSTAC<br />
impedence<br />
matrix<br />
(distance)<br />
Comparison<br />
Querys<br />
Querys<br />
Internet websites of European railway companies<br />
6.3 <strong>ETIS</strong> testing phase – Passenger travel times rail<br />
The goal is to produce an ASCII matrix of the minimum travel times and the corresponding type<br />
of train and number of train changes for these connections between NUTS2 centroids in the 27<br />
countries using HAFAS, which corresponds to indicator 2.6.1. By combining this matrix with<br />
geocoding information about the train stations, a user can produce contour plots of travel times,<br />
travel times on links, or other useful spatial graphics. The 3 train stations nearest the centroids<br />
will first be identified. The shortest travel times and other information about the connections<br />
between these train stations will then be extracted from HAFAS. IVT does not yet have the<br />
HAFAS server to calculate the travel times between the main stations in each NUTS2 zone. In<br />
the short term however, the travel times between at least 400 NUTS2 centers can be calculated<br />
for the testing phase, based on the existing IVT rail model. The NUTS2 centroids will first be<br />
added to this model and the nearest 3 stations located, as would be done with the HAFAS<br />
38<br />
R20040089.doc<br />
27 May 2004