- Page 1:
DISCUSSION DRAFT - FOR ADVICE OF MI
- Page 5 and 6:
Contents 1. Executive summary .....
- Page 7:
Terms of reference ► ► ► ►
- Page 10 and 11:
FCI FTE IPP Internally Appropriated
- Page 13 and 14:
1. Executive summary Confidential |
- Page 15 and 16:
► ► ► Maintain significant ex
- Page 17 and 18:
Finding: The Initial Preliminary Pr
- Page 19 and 20:
Administrative, support and overhea
- Page 21 and 22:
Prior to implementing capacity rati
- Page 23 and 24:
contribute to sound fiscal manageme
- Page 25 and 26:
2. Background and context 2.1 Provi
- Page 27 and 28:
2.5 Project objectives and scope In
- Page 29 and 30:
3. Budget development and forecasti
- Page 31 and 32:
3.2.2 Out of scope The areas below
- Page 33 and 34:
Objective: Top recommendations: Rev
- Page 35 and 36:
$ million Chart 3.1 - Operating Sur
- Page 37 and 38:
services ► Tangible capital asset
- Page 39 and 40:
In this report where we refer to th
- Page 41 and 42:
3.4.2 Budget timeline 1) The Initia
- Page 43 and 44:
3.5 Multi-year forecasts 3.5.1 Fore
- Page 45 and 46:
3.5.2 Review of SY2014/15 and SY201
- Page 47 and 48:
Included in the revenue adjustments
- Page 49 and 50: SY2016/17 and SY2017/18 forecast We
- Page 51 and 52: 4. Accumulated surpluses and defici
- Page 53 and 54: 4.2.2 Out of scope The areas below
- Page 55 and 56: $ million 4.4 Review of historical
- Page 57 and 58: History of forecasted deficits vs a
- Page 59 and 60: Internally Appropriated Expenses Th
- Page 61 and 62: EY was advised by VBE that operatin
- Page 63 and 64: $ million $ million $ million To co
- Page 65 and 66: Maintaining a net accumulated surpl
- Page 67 and 68: School year SY2014/15 Accumulated S
- Page 69 and 70: 5. Administrative, support and over
- Page 71 and 72: In the pages that follow, key findi
- Page 73 and 74: Objective: Identify opportunities t
- Page 75 and 76: 5.4.2 Non - Provincial grant (MEd)
- Page 77 and 78: Finding 5.2 VBE received a $0.06M g
- Page 79 and 80: Finding 5.4 VBE is among the top di
- Page 81 and 82: 5.4.7 Tuition - offshore tuition fe
- Page 83 and 84: Most school districts, including Va
- Page 85 and 86: Finding 5.9 In absolute terms, VBE
- Page 87 and 88: VBE’s Facilities team performed a
- Page 89 and 90: 5.4.13 Summary of revenue opportuni
- Page 91 and 92: 600 14.0% Operating expenditure Mil
- Page 93 and 94: If VBE were to achieve the same lev
- Page 95 and 96: Based on our analysis of the previo
- Page 97 and 98: Table 5.5: VBE and Subset Districts
- Page 99: Table 5.6 : VBE and Surrey average
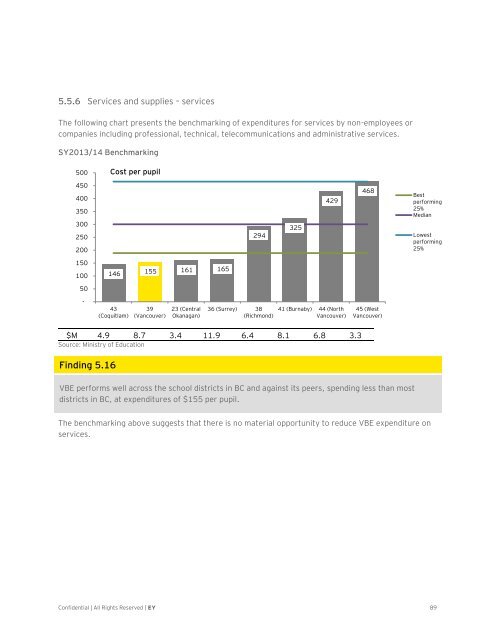
- Page 103 and 104: 5.5.8 Services and supplies - profe
- Page 105 and 106: 5.5.10 Services and supplies - dues
- Page 107 and 108: 5.5.12 Services and supplies - inte
- Page 109 and 110: 5.5.14 Services and supplies - util
- Page 111 and 112: 5.5.16 Cost efficiency initiatives
- Page 113 and 114: Table 5.10: Management proposals 20
- Page 115 and 116: Table 5.12: New initiatives Initiat
- Page 117 and 118: Table 5.13: Implementation of Deloi
- Page 119 and 120: Table 5.14: Summary of revenue and
- Page 121 and 122: 6. Capital asset management 6.1 Int
- Page 123 and 124: 6.2 Scope and approach 6.2.1 Work s
- Page 125 and 126: Top recommen dations: VBE develop t
- Page 127 and 128: Table 6.2: Summary of District’s
- Page 129 and 130: 6.4.3 Roles and responsibilities Th
- Page 131 and 132: Current state Section Excess Surplu
- Page 133 and 134: 6.5.2 Capital project planning proc
- Page 135 and 136: ► 2013/14 Capital Plan covering t
- Page 137 and 138: ► ► The lengthy consultation pr
- Page 139 and 140: Recommendation 6.8 The Ministry rev
- Page 141 and 142: Finding 6.5: Reduction in excess su
- Page 143 and 144: Number of Surplus seats In contrast
- Page 145 and 146: Utilization Historical and Projecte
- Page 147 and 148: Low utilization in the east (74%) a
- Page 149 and 150: The assumptions that predicate the
- Page 151 and 152:
6.6.5 Net annual cost savings throu
- Page 153 and 154:
This has a direct impact on the num
- Page 155 and 156:
Table 6.6: Summary of potential ann
- Page 157 and 158:
If the 2009 BC Assessment property
- Page 159 and 160:
► A school with low enrolment may
- Page 161 and 162:
6) Board decision Any decision to c
- Page 163 and 164:
uildings). 6.7 Seismic mitigation p
- Page 165 and 166:
Table 6.9: Summary of District’s
- Page 167 and 168:
Recommendation 6.26 Where VBE is ab
- Page 169 and 170:
aggressive capacity rationalization
- Page 171 and 172:
Age (Years) 6.8.2 Age of District
- Page 173 and 174:
In addition, VBE purports that thes
- Page 175 and 176:
6.8.4 Reducing annual maintenance c
- Page 177 and 178:
Recommendation 6.33 Other school di
- Page 179 and 180:
access the upside of land re-develo
- Page 181 and 182:
Table 6.14: Summary of potential fi
- Page 183 and 184:
7. Board governance 7.1 Introductio
- Page 185 and 186:
► Accomplish goals designed to br
- Page 187 and 188:
7.2.3 Methodology and approach Plan
- Page 189 and 190:
► Leading practice and peer analy
- Page 191 and 192:
7.4 Key findings and recommendation
- Page 193 and 194:
Board Priorities The Comptroller Ge
- Page 195 and 196:
These Standing Committees are addit
- Page 197 and 198:
to a hybrid of VBE’s People and S
- Page 199 and 200:
Board of Trustees’ performance se
- Page 201 and 202:
Recommendation 7.4.A Board of Trust
- Page 203 and 204:
Recommendation 7.5.B During the cou
- Page 205 and 206:
8. Other matters All other matters
- Page 207 and 208:
9. Summary of recommendations Ref R
- Page 209 and 210:
Ref Recommendation Ministry of Educ
- Page 211 and 212:
Ref Recommendation Ministry of Educ
- Page 213 and 214:
Ref Recommendation Ministry of Educ
- Page 215 and 216:
Ref Recommendation Ministry of Educ
- Page 217 and 218:
Appendices 9. Other matters Confide
- Page 219 and 220:
Document Overview of Class Size and
- Page 221 and 222:
Document Class size and student ach
- Page 223 and 224:
Document Vancouver Board of Educati
- Page 225 and 226:
APPENDIX C: Budget documents prepar
- Page 227 and 228:
Document 5 A Restoration Budget pre
- Page 229 and 230:
Vancouver Surrey Central Okanagan V
- Page 231 and 232:
APPENDIX F: Progress review of prev
- Page 233 and 234:
Previous recommendations ► ► po
- Page 235 and 236:
Previous recommendations ► ►