Abstract form
Abstract form
Abstract form
You also want an ePaper? Increase the reach of your titles
YUMPU automatically turns print PDFs into web optimized ePapers that Google loves.
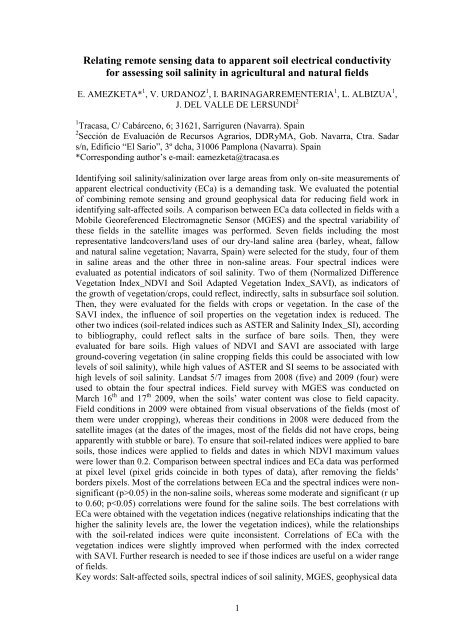
Relating remote sensing data to apparent soil electrical conductivity<br />
for assessing soil salinity in agricultural and natural fields<br />
E. AMEZKETA* 1 , V. URDANOZ 1 , I. BARINAGARREMENTERIA 1 , L. ALBIZUA 1 ,<br />
J. DEL VALLE DE LERSUNDI 2<br />
1 Tracasa, C/ Cabárceno, 6; 31621, Sarriguren (Navarra). Spain<br />
2 Sección de Evaluación de Recursos Agrarios, DDRyMA, Gob. Navarra, Ctra. Sadar<br />
s/n, Edificio “El Sario”, 3º dcha, 31006 Pamplona (Navarra). Spain<br />
*Corresponding author’s e-mail: eamezketa@tracasa.es<br />
Identifying soil salinity/salinization over large areas from only on-site measurements of<br />
apparent electrical conductivity (ECa) is a demanding task. We evaluated the potential<br />
of combining remote sensing and ground geophysical data for reducing field work in<br />
identifying salt-affected soils. A comparison between ECa data collected in fields with a<br />
Mobile Georeferenced Electromagnetic Sensor (MGES) and the spectral variability of<br />
these fields in the satellite images was per<strong>form</strong>ed. Seven fields including the most<br />
representative landcovers/land uses of our dry-land saline area (barley, wheat, fallow<br />
and natural saline vegetation; Navarra, Spain) were selected for the study, four of them<br />
in saline areas and the other three in non-saline areas. Four spectral indices were<br />
evaluated as potential indicators of soil salinity. Two of them (Normalized Difference<br />
Vegetation Index_NDVI and Soil Adapted Vegetation Index_SAVI), as indicators of<br />
the growth of vegetation/crops, could reflect, indirectly, salts in subsurface soil solution.<br />
Then, they were evaluated for the fields with crops or vegetation. In the case of the<br />
SAVI index, the influence of soil properties on the vegetation index is reduced. The<br />
other two indices (soil-related indices such as ASTER and Salinity Index_SI), according<br />
to bibliography, could reflect salts in the surface of bare soils. Then, they were<br />
evaluated for bare soils. High values of NDVI and SAVI are associated with large<br />
ground-covering vegetation (in saline cropping fields this could be associated with low<br />
levels of soil salinity), while high values of ASTER and SI seems to be associated with<br />
high levels of soil salinity. Landsat 5/7 images from 2008 (five) and 2009 (four) were<br />
used to obtain the four spectral indices. Field survey with MGES was conducted on<br />
March 16 th and 17 th 2009, when the soils’ water content was close to field capacity.<br />
Field conditions in 2009 were obtained from visual observations of the fields (most of<br />
them were under cropping), whereas their conditions in 2008 were deduced from the<br />
satellite images (at the dates of the images, most of the fields did not have crops, being<br />
apparently with stubble or bare). To ensure that soil-related indices were applied to bare<br />
soils, those indices were applied to fields and dates in which NDVI maximum values<br />
were lower than 0.2. Comparison between spectral indices and ECa data was per<strong>form</strong>ed<br />
at pixel level (pixel grids coincide in both types of data), after removing the fields’<br />
borders pixels. Most of the correlations between ECa and the spectral indices were nonsignificant<br />
(p>0.05) in the non-saline soils, whereas some moderate and significant (r up<br />
to 0.60; p


