Abstract form
Abstract form
Abstract form

Create successful ePaper yourself
Turn your PDF publications into a flip-book with our unique Google optimized e-Paper software.
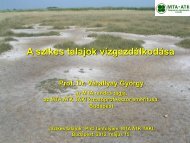
Mapping the risk of soil salinization: application of electromagnetic<br />
induction and non-parametric geostatistics<br />
Houria DAKAK* 12 , Brahim SOUDI 3 , Ahmed DOUAIK 1 , Aicha BENMOHAMMADI 2 ,<br />
Mohamed BADRAOUI 1 , Fatima-Zohra CHERKAOUI 4<br />
1: National Institute of Agricultural Research (INRA), Avenue de la Victoire, BP 415,<br />
Rabat, Morocco ;<br />
2: UFR ST 11/DOC/K, Department of Earth Sciences, Ibn Tofail University, Kenitra,<br />
Morocco ;<br />
3: Department of Soil Science, Hassan II Institute of Agricultural Sciences and<br />
Veterinary Medicine, Rabat, Morocco.<br />
4: Regional Office of Agricultural Development of Tadla (ORMVAT), Fqih Ben Saleh,<br />
Morocco.<br />
For a better management of salt-affected soils, the knowledge of the magnitude, the<br />
spatial extent and the evolution with time of soil salinity is required. Soil salinity is<br />
determined, conventionally, by measuring the electrical conductivity of a saturated past<br />
extract (ECe). However, given the spatio-temporal variability of the salinity, numerous<br />
samples are necessary, which makes the conventional procedure laborious and<br />
expensive. As an alternative, the apparent electrical conductivity of soil (ECa) can be<br />
measured in the field by the use of the electromagnetic induction (EMI). This procedure<br />
is fast and allows making an extensive sampling in space and monitoring in time. The<br />
study area covers 2060 ha in the irrigation district of Tadla, central Morocco. Twelve<br />
samples were taken for the determination of ECe while about hundred ECa<br />
measurements were realized with the EM38 instrument of Geonics. The pairs of ECe-<br />
ECa values allowed establishing the calibration equation permitting to convert the ECa<br />
into ECe values. This equation was used to convert the other ECa values for which there<br />
was no measure of ECe. Then, geostatistics was used for the establishment of the maps<br />
of the risk of soil salinization. First of all, a threshold for risk of soil salinization was<br />
determined and indicators were built. Then, the spatial variability of these indicators<br />
was described and modeled using the variogram. Finally, the maps were generated<br />
based on a non-parametric method of geostatistical interpolation, i.e., indicator kriging.<br />
The results showed that the study area presents various degrees of soil salinization risk.<br />
In the centre of this area, the risk is low; the major part of the study area has a moderate<br />
risk while the south and northwestern parts have a high risk. In conclusion, the<br />
combined use of the electrical conductivity, electromagnetic induction and geostatistics<br />
allowed establishing a reliable soil salinization risk map. This in<strong>form</strong>ation could serve<br />
as a basis for any rehabilitation effort of salt-affected soils, in the future, according to<br />
their actual risk of salinization and not by considering the average risk of the whole<br />
study area.<br />
Keywords. Electrical conductivity, indicator kriging, salinization risk, variogram.<br />
9