census
census
census

You also want an ePaper? Increase the reach of your titles
YUMPU automatically turns print PDFs into web optimized ePapers that Google loves.
Nativity<br />
Real median household income rose<br />
by 3.3 percent to $42,040 for<br />
foreign-born households between<br />
2004 and 2005 (Table 1). The apparent<br />
change for native households was<br />
not statistically significant. 15 Among<br />
foreign-born households, those maintained<br />
by a householder who was a<br />
naturalized citizen experienced an<br />
increase in median income of 5.0 percent<br />
to $50,030, which was higher<br />
than that of native households<br />
($46,897). 16<br />
Region<br />
Real median income of households<br />
rose in the Northeast (2.9 percent)<br />
and in the West (1.5 percent) between<br />
2004 and 2005. The apparent<br />
change in the median income of<br />
households for the other two regions<br />
was not statistically significant<br />
(Table 1). 17 The last time the<br />
Northeast experienced an annual<br />
increase in median household income<br />
was in 2000; for the West it was in<br />
1999. In 2005, households in the<br />
Northeast had the highest household<br />
income ($50,882), followed by households<br />
in the West ($50,002) and the<br />
Midwest ($45,950). Households in<br />
the South had the lowest median<br />
income ($42,138).<br />
15<br />
Native households are those in which the<br />
householder was born in the United States,<br />
Puerto Rico, or certain U.S. island areas (Guam,<br />
the Northern Mariana islands, or the Virgin<br />
Islands of the United States) or was born in a<br />
foreign country but had at least one parent who<br />
was a U.S. citizen. All other households are considered<br />
foreign born regardless of the date of<br />
entry into the United States or citizenship status.<br />
The CPS does not interview households in Puerto<br />
Rico. Of all households, 87.1 percent were<br />
native households, 6.1 percent were households<br />
with foreign-born householders who were naturalized<br />
citizens, and 6.8 percent were noncitizen<br />
households.<br />
16<br />
The difference between the percent<br />
increases in median household income of<br />
foreign-born households and households maintained<br />
by a naturalized citizen was not statistically<br />
significant.<br />
17<br />
The difference between the increases in<br />
median household income of the Northeast and<br />
the West was not statistically significant.<br />
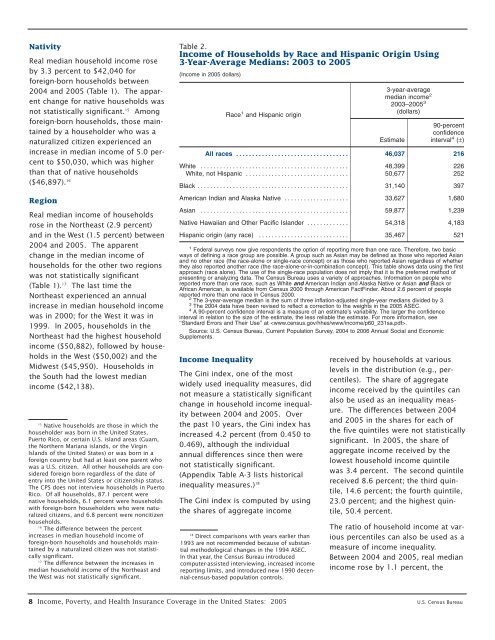
Table 2.<br />
Income of Households by Race and Hispanic Origin Using<br />
3-Year-Average Medians: 2003 to 2005<br />
(Income in 2005 dollars)<br />
Income Inequality<br />
Race 1 and Hispanic origin<br />
The Gini index, one of the most<br />
widely used inequality measures, did<br />
not measure a statistically significant<br />
change in household income inequality<br />
between 2004 and 2005. Over<br />
the past 10 years, the Gini index has<br />
increased 4.2 percent (from 0.450 to<br />
0.469), although the individual<br />
annual differences since then were<br />
not statistically significant.<br />
(Appendix Table A-3 lists historical<br />
inequality measures.) 18<br />
The Gini index is computed by using<br />
the shares of aggregate income<br />
3-year-average<br />
median income 2<br />
2003–2005 3<br />
(dollars)<br />
Estimate<br />
90-percent<br />
confidence<br />
interval 4 (±)<br />
All races . . . ................................ 46,037 216<br />
White . . . ........................................... 48,399 226<br />
White, not Hispanic . . .............................. 50,677 252<br />
Black . . . ............................................ 31,140 397<br />
American Indian and Alaska Native . . . . . . . . . . . . . . . . . . . . 33,627 1,680<br />
Asian . . . ........................................... 59,877 1,239<br />
Native Hawaiian and Other Pacific Islander . . . . . . . . . . . . . 54,318 4,183<br />
Hispanic origin (any race) . . . . . . . . . . . . . . . . . . . . . . . . . . . . 35,467 521<br />
1 Federal surveys now give respondents the option of reporting more than one race. Therefore, two basic<br />
ways of defining a race group are possible. A group such as Asian may be defined as those who reported Asian<br />
and no other race (the race-alone or single-race concept) or as those who reported Asian regardless of whether<br />
they also reported another race (the race-alone-or-in-combination concept). This table shows data using the first<br />
approach (race alone). The use of the single-race population does not imply that it is the preferred method of<br />
presenting or analyzing data. The Census Bureau uses a variety of approaches. Information on people who<br />
reported more than one race, such as White and American Indian and Alaska Native or Asian and Black or<br />
African American, is available from Census 2000 through American FactFinder. About 2.6 percent of people<br />
reported more than one race in Census 2000.<br />
2 The 3-year-average median is the sum of three inflation-adjusted single-year medians divided by 3.<br />
3 The 2004 data have been revised to reflect a correction to the weights in the 2005 ASEC.<br />
4 A 90-percent confidence interval is a measure of an estimate’s variability. The larger the confidence<br />
interval in relation to the size of the estimate, the less reliable the estimate. For more information, see<br />
‘‘Standard Errors and Their Use’’ at .<br />
Source: U.S. Census Bureau, Current Population Survey, 2004 to 2006 Annual Social and Economic<br />
Supplements.<br />
18<br />
Direct comparisons with years earlier than<br />
1993 are not recommended because of substantial<br />
methodological changes in the 1994 ASEC.<br />
In that year, the Census Bureau introduced<br />
computer-assisted interviewing, increased income<br />
reporting limits, and introduced new 1990 decennial-<strong>census</strong>-based<br />
population controls.<br />
received by households at various<br />
levels in the distribution (e.g., percentiles).<br />
The share of aggregate<br />
income received by the quintiles can<br />
also be used as an inequality measure.<br />
The differences between 2004<br />
and 2005 in the shares for each of<br />
the five quintiles were not statistically<br />
significant. In 2005, the share of<br />
aggregate income received by the<br />
lowest household income quintile<br />
was 3.4 percent. The second quintile<br />
received 8.6 percent; the third quintile,<br />
14.6 percent; the fourth quintile,<br />
23.0 percent; and the highest quintile,<br />
50.4 percent.<br />
The ratio of household income at various<br />
percentiles can also be used as a<br />
measure of income inequality.<br />
Between 2004 and 2005, real median<br />
income rose by 1.1 percent, the<br />
8 Income, Poverty, and Health Insurance Coverage in the United States: 2005 U.S. Census Bureau