census
census
census

Create successful ePaper yourself
Turn your PDF publications into a flip-book with our unique Google optimized e-Paper software.
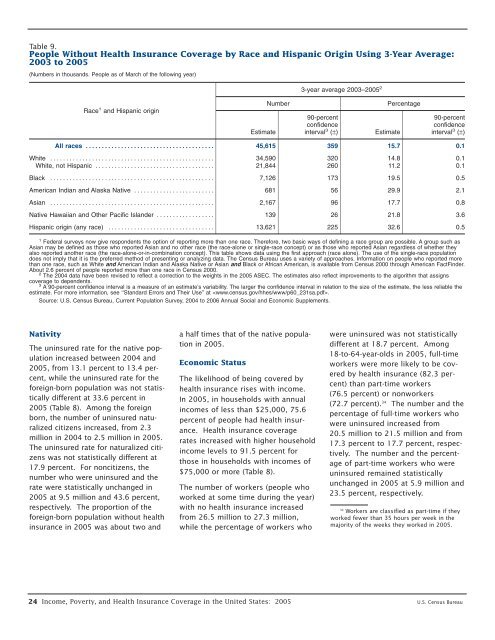
Table 9.<br />
People Without Health Insurance Coverage by Race and Hispanic Origin Using 3-Year Average:<br />
2003 to 2005<br />
(Numbers in thousands. People as of March of the following year)<br />
3-year average 2003–2005 2<br />
Race 1 and Hispanic origin<br />
Estimate<br />
Number<br />
90-percent<br />
confidence<br />
interval 3 (±)<br />
Percentage<br />
Estimate<br />
90-percent<br />
confidence<br />
interval 3 (±)<br />
All races . . . ..................................... 45,615 359 15.7 0.1<br />
White . . . . . . . . . . . . . . . . . . . . . . . . . . . . . . . . . . . . . . . . . . ......... 34,590 320 14.8 0.1<br />
White, not Hispanic . . . . . . . . . . . . . . . . . . . . . . . . . . . . . . . . . . . . . 21,844 260 11.2 0.1<br />
Black . . . . ............................................... 7,126 173 19.5 0.5<br />
American Indian and Alaska Native . . . . . . . . ................. 681 56 29.9 2.1<br />
Asian . . . ................................................ 2,167 96 17.7 0.8<br />
Native Hawaiian and Other Pacific Islander . . . . . . . . .......... 139 26 21.8 3.6<br />
Hispanic origin (any race) . . . . . . . . . . . . . . . . . . . . . . . . . . . . . . . . . 13,621 225 32.6 0.5<br />
1 Federal surveys now give respondents the option of reporting more than one race. Therefore, two basic ways of defining a race group are possible. A group such as<br />
Asian may be defined as those who reported Asian and no other race (the race-alone or single-race concept) or as those who reported Asian regardless of whether they<br />
also reported another race (the race-alone-or-in-combination concept). This table shows data using the first approach (race alone). The use of the single-race population<br />
does not imply that it is the preferred method of presenting or analyzing data. The Census Bureau uses a variety of approaches. Information on people who reported more<br />
than one race, such as White and American Indian and Alaska Native or Asian and Black or African American, is available from Census 2000 through American FactFinder.<br />
About 2.6 percent of people reported more than one race in Census 2000.<br />
2 The 2004 data have been revised to reflect a correction to the weights in the 2005 ASEC. The estimates also reflect improvements to the algorithm that assigns<br />
coverage to dependents.<br />
3 A 90-percent confidence interval is a measure of an estimate’s variability. The larger the confidence interval in relation to the size of the estimate, the less reliable the<br />
estimate. For more information, see ‘‘Standard Errors and Their Use’’ at .<br />
Source: U.S. Census Bureau, Current Population Survey, 2004 to 2006 Annual Social and Economic Supplements.<br />
Nativity<br />
The uninsured rate for the native population<br />
increased between 2004 and<br />
2005, from 13.1 percent to 13.4 percent,<br />
while the uninsured rate for the<br />
foreign-born population was not statistically<br />
different at 33.6 percent in<br />
2005 (Table 8). Among the foreign<br />
born, the number of uninsured naturalized<br />
citizens increased, from 2.3<br />
million in 2004 to 2.5 million in 2005.<br />
The uninsured rate for naturalized citizens<br />
was not statistically different at<br />
17.9 percent. For noncitizens, the<br />
number who were uninsured and the<br />
rate were statistically unchanged in<br />
2005 at 9.5 million and 43.6 percent,<br />
respectively. The proportion of the<br />
foreign-born population without health<br />
insurance in 2005 was about two and<br />
a half times that of the native population<br />
in 2005.<br />
Economic Status<br />
The likelihood of being covered by<br />
health insurance rises with income.<br />
In 2005, in households with annual<br />
incomes of less than $25,000, 75.6<br />
percent of people had health insurance.<br />
Health insurance coverage<br />
rates increased with higher household<br />
income levels to 91.5 percent for<br />
those in households with incomes of<br />
$75,000 or more (Table 8).<br />
The number of workers (people who<br />
worked at some time during the year)<br />
with no health insurance increased<br />
from 26.5 million to 27.3 million,<br />
while the percentage of workers who<br />
were uninsured was not statistically<br />
different at 18.7 percent. Among<br />
18-to-64-year-olds in 2005, full-time<br />
workers were more likely to be covered<br />
by health insurance (82.3 percent)<br />
than part-time workers<br />
(76.5 percent) or nonworkers<br />
(72.7 percent). 34 The number and the<br />
percentage of full-time workers who<br />
were uninsured increased from<br />
20.5 million to 21.5 million and from<br />
17.3 percent to 17.7 percent, respectively.<br />
The number and the percentage<br />
of part-time workers who were<br />
uninsured remained statistically<br />
unchanged in 2005 at 5.9 million and<br />
23.5 percent, respectively.<br />
34<br />
Workers are classified as part-time if they<br />
worked fewer than 35 hours per week in the<br />
majority of the weeks they worked in 2005.<br />
24 Income, Poverty, and Health Insurance Coverage in the United States: 2005 U.S. Census Bureau