census
census
census
You also want an ePaper? Increase the reach of your titles
YUMPU automatically turns print PDFs into web optimized ePapers that Google loves.
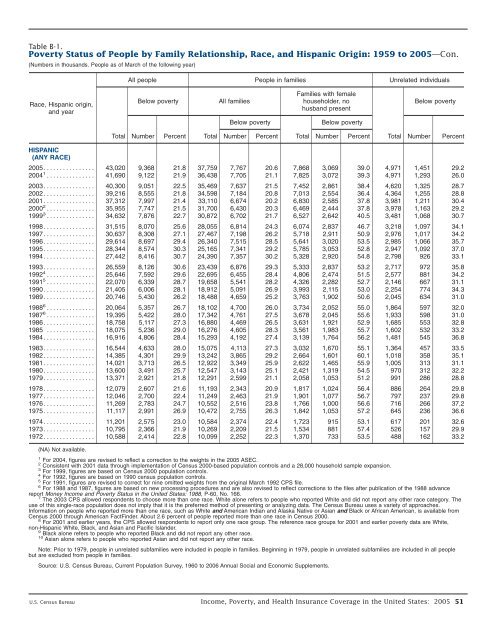
Table B-1.<br />
Poverty Status of People by Family Relationship, Race, and Hispanic Origin: 1959 to 2005—Con.<br />
(Numbers in thousands. People as of March of the following year)<br />
All people<br />
People in families<br />
Unrelated individuals<br />
Race, Hispanic origin,<br />
and year<br />
Below poverty<br />
All families<br />
Below poverty<br />
Families with female<br />
householder, no<br />
husband present<br />
Below poverty<br />
Below poverty<br />
Total<br />
Number Percent Total<br />
Number Percent Total Number Percent<br />
Total<br />
Number<br />
Percent<br />
HISPANIC<br />
(ANY RACE)<br />
2005. . . . ............ 43,020 9,368 21.8 37,759 7,767 20.6 7,868 3,069 39.0 4,971 1,451 29.2<br />
2004 1 ............... 41,690 9,122 21.9 36,438 7,705 21.1 7,825 3,072 39.3 4,971 1,293 26.0<br />
2003. . . . . . . . . . . . . . . . 40,300 9,051 22.5 35,469 7,637 21.5 7,452 2,861 38.4 4,620 1,325 28.7<br />
2002. . . . . . . . . . . . . . . . 39,216 8,555 21.8 34,598 7,184 20.8 7,013 2,554 36.4 4,364 1,255 28.8<br />
2001. . . . . . . . . . . . . . . . 37,312 7,997 21.4 33,110 6,674 20.2 6,830 2,585 37.8 3,981 1,211 30.4<br />
2000 2 ............... 35,955 7,747 21.5 31,700 6,430 20.3 6,469 2,444 37.8 3,978 1,163 29.2<br />
1999 3 ............... 34,632 7,876 22.7 30,872 6,702 21.7 6,527 2,642 40.5 3,481 1,068 30.7<br />
1998. . . . . . . . . . . . . . . . 31,515 8,070 25.6 28,055 6,814 24.3 6,074 2,837 46.7 3,218 1,097 34.1<br />
1997. . . . . . . . . . . . . . . . 30,637 8,308 27.1 27,467 7,198 26.2 5,718 2,911 50.9 2,976 1,017 34.2<br />
1996. . . . . . . . . . . . . . . . 29,614 8,697 29.4 26,340 7,515 28.5 5,641 3,020 53.5 2,985 1,066 35.7<br />
1995. . . . . . . . . . . . . . . . 28,344 8,574 30.3 25,165 7,341 29.2 5,785 3,053 52.8 2,947 1,092 37.0<br />
1994. . . . . . . . . . . . . . . . 27,442 8,416 30.7 24,390 7,357 30.2 5,328 2,920 54.8 2,798 926 33.1<br />
1993. . . . . . . . . . . . . . . . 26,559 8,126 30.6 23,439 6,876 29.3 5,333 2,837 53.2 2,717 972 35.8<br />
1992 4 ............... 25,646 7,592 29.6 22,695 6,455 28.4 4,806 2,474 51.5 2,577 881 34.2<br />
1991 5 ............... 22,070 6,339 28.7 19,658 5,541 28.2 4,326 2,282 52.7 2,146 667 31.1<br />
1990. . . . . . . . . . . . . . . . 21,405 6,006 28.1 18,912 5,091 26.9 3,993 2,115 53.0 2,254 774 34.3<br />
1989. . . . . . . . . . . . . . . . 20,746 5,430 26.2 18,488 4,659 25.2 3,763 1,902 50.6 2,045 634 31.0<br />
1988 6 ............... 20,064 5,357 26.7 18,102 4,700 26.0 3,734 2,052 55.0 1,864 597 32.0<br />
1987 6 ............... 19,395 5,422 28.0 17,342 4,761 27.5 3,678 2,045 55.6 1,933 598 31.0<br />
1986. . . . . . . . . . . . . . . . 18,758 5,117 27.3 16,880 4,469 26.5 3,631 1,921 52.9 1,685 553 32.8<br />
1985 . . . ............ 18,075 5,236 29.0 16,276 4,605 28.3 3,561 1,983 55.7 1,602 532 33.2<br />
1984. . . . . . . . . . . . . . . . 16,916 4,806 28.4 15,293 4,192 27.4 3,139 1,764 56.2 1,481 545 36.8<br />
1983. . . . . . . . . . . . . . . . 16,544 4,633 28.0 15,075 4,113 27.3 3,032 1,670 55.1 1,364 457 33.5<br />
1982. . . . . . . . . . . . . . . . 14,385 4,301 29.9 13,242 3,865 29.2 2,664 1,601 60.1 1,018 358 35.1<br />
1981. . . . . . . . . . . . . . . . 14,021 3,713 26.5 12,922 3,349 25.9 2,622 1,465 55.9 1,005 313 31.1<br />
1980. . . . . . . . . . . . . . . . 13,600 3,491 25.7 12,547 3,143 25.1 2,421 1,319 54.5 970 312 32.2<br />
1979. . . . . . . . . . . . . . . . 13,371 2,921 21.8 12,291 2,599 21.1 2,058 1,053 51.2 991 286 28.8<br />
1978. . . . . . . . . . . . . . . . 12,079 2,607 21.6 11,193 2,343 20.9 1,817 1,024 56.4 886 264 29.8<br />
1977. . . . . . . . . . . . . . . . 12,046 2,700 22.4 11,249 2,463 21.9 1,901 1,077 56.7 797 237 29.8<br />
1976. . . . . . . . . . . . . . . . 11,269 2,783 24.7 10,552 2,516 23.8 1,766 1,000 56.6 716 266 37.2<br />
1975. . . . ............ 11,117 2,991 26.9 10,472 2,755 26.3 1,842 1,053 57.2 645 236 36.6<br />
1974. . . . . . . . . . . . . . . . 11,201 2,575 23.0 10,584 2,374 22.4 1,723 915 53.1 617 201 32.6<br />
1973. . . . ............ 10,795 2,366 21.9 10,269 2,209 21.5 1,534 881 57.4 526 157 29.9<br />
1972. . . . . . . . . . . . . . . . 10,588 2,414 22.8 10,099 2,252 22.3 1,370 733 53.5 488 162 33.2<br />
(NA) Not available.<br />
1 For 2004, figures are revised to reflect a correction to the weights in the 2005 ASEC.<br />
2 Consistent with 2001 data through implementation of Census 2000-based population controls and a 28,000 household sample expansion.<br />
3 For 1999, figures are based on Census 2000 population controls.<br />
4 For 1992, figures are based on 1990 <strong>census</strong> population controls.<br />
5 For 1991, figures are revised to correct for nine omitted weights from the original March 1992 CPS file.<br />
6 For 1988 and 1987, figures are based on new processing procedures and are also revised to reflect corrections to the files after publication of the 1988 advance<br />
report Money Income and Poverty Status in the United States: 1988, P-60, No. 166.<br />
7 The 2003 CPS allowed respondents to choose more than one race. White alone refers to people who reported White and did not report any other race category. The<br />
use of this single-race population does not imply that it is the preferred method of presenting or analyzing data. The Census Bureau uses a variety of approaches.<br />
Information on people who reported more than one race, such as White and American Indian and Alaska Native or Asian and Black or African American, is available from<br />
Census 2000 through American FactFinder. About 2.6 percent of people reported more than one race in Census 2000.<br />
8 For 2001 and earlier years, the CPS allowed respondents to report only one race group. The reference race groups for 2001 and earlier poverty data are White,<br />
non-Hispanic White, Black, and Asian and Pacific Islander.<br />
9 Black alone refers to people who reported Black and did not report any other race.<br />
10 Asian alone refers to people who reported Asian and did not report any other race.<br />
Note: Prior to 1979, people in unrelated subfamilies were included in people in families. Beginning in 1979, people in unrelated subfamilies are included in all people<br />
but are excluded from people in families.<br />
Source: U.S. Census Bureau, Current Population Survey, 1960 to 2006 Annual Social and Economic Supplements.<br />
U.S. Census Bureau Income, Poverty, and Health Insurance Coverage in the United States: 2005 51


