census
census
census

You also want an ePaper? Increase the reach of your titles
YUMPU automatically turns print PDFs into web optimized ePapers that Google loves.
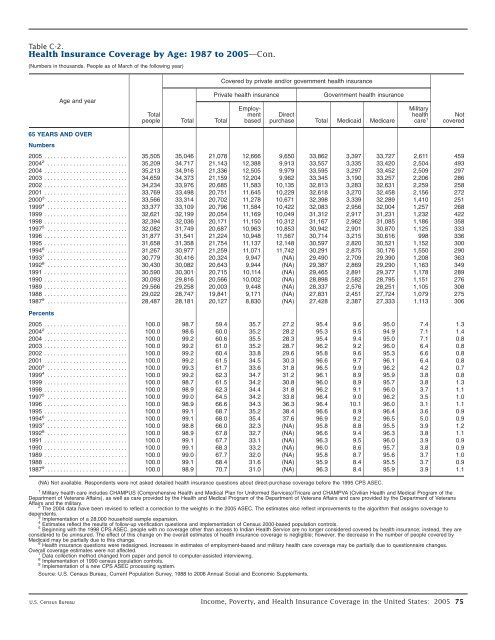
Table C-2.<br />
Health Insurance Coverage by Age: 1987 to 2005—Con.<br />
(Numbers in thousands. People as of March of the following year)<br />
Covered by private and/or government health insurance<br />
Age and year<br />
Total<br />
people<br />
Total<br />
Private health insurance<br />
Total<br />
Employment<br />
based<br />
Government health insurance<br />
Direct<br />
purchase Total Medicaid Medicare<br />
Military<br />
health<br />
care 1<br />
Not<br />
covered<br />
65 YEARS AND OVER<br />
Numbers<br />
2005 .......................... 35,505 35,046 21,078 12,666 9,650 33,862 3,397 33,727 2,611 459<br />
2004 2 ......................... 35,209 34,717 21,143 12,388 9,913 33,557 3,335 33,420 2,504 493<br />
2004 .......................... 35,213 34,916 21,336 12,505 9,979 33,595 3,297 33,452 2,509 297<br />
2003 .......................... 34,659 34,373 21,159 12,204 9,962 33,345 3,190 33,257 2,206 286<br />
2002 .......................... 34,234 33,976 20,685 11,583 10,135 32,813 3,283 32,631 2,259 258<br />
2001 .......................... 33,769 33,498 20,751 11,645 10,229 32,618 3,270 32,458 2,156 272<br />
2000 3 ......................... 33,566 33,314 20,702 11,278 10,671 32,398 3,339 32,289 1,410 251<br />
1999 4 ......................... 33,377 33,109 20,796 11,584 10,422 32,083 2,956 32,004 1,257 268<br />
1999 .......................... 32,621 32,199 20,054 11,169 10,049 31,312 2,917 31,231 1,232 422<br />
1998 .......................... 32,394 32,036 20,171 11,150 10,312 31,167 2,962 31,085 1,186 358<br />
1997 5 ......................... 32,082 31,749 20,687 10,963 10,853 30,942 2,901 30,870 1,125 333<br />
1996 .......................... 31,877 31,541 21,224 10,948 11,567 30,714 3,215 30,616 998 336<br />
1995 .......................... 31,658 31,358 21,754 11,137 12,148 30,597 2,820 30,521 1,152 300<br />
1994 6 ......................... 31,267 30,977 21,259 11,071 11,742 30,291 2,875 30,176 1,550 290<br />
1993 7 ......................... 30,779 30,416 20,324 9,947 (NA) 29,490 2,709 29,390 1,208 363<br />
1992 8 ......................... 30,430 30,082 20,643 9,944 (NA) 29,387 2,869 29,290 1,163 349<br />
1991 .......................... 30,590 30,301 20,715 10,114 (NA) 29,465 2,891 29,377 1,178 289<br />
1990 .......................... 30,093 29,816 20,566 10,002 (NA) 28,898 2,582 28,795 1,151 276<br />
1989 .......................... 29,566 29,258 20,003 9,448 (NA) 28,337 2,576 28,251 1,105 308<br />
1988 .......................... 29,022 28,747 19,841 9,171 (NA) 27,831 2,451 27,724 1,079 275<br />
1987 9 ......................... 28,487 28,181 20,127 8,830 (NA) 27,428 2,387 27,333 1,113 306<br />
Percents<br />
2005 .......................... 100.0 98.7 59.4 35.7 27.2 95.4 9.6 95.0 7.4 1.3<br />
2004 2 ......................... 100.0 98.6 60.0 35.2 28.2 95.3 9.5 94.9 7.1 1.4<br />
2004 .......................... 100.0 99.2 60.6 35.5 28.3 95.4 9.4 95.0 7.1 0.8<br />
2003 .......................... 100.0 99.2 61.0 35.2 28.7 96.2 9.2 96.0 6.4 0.8<br />
2002 .......................... 100.0 99.2 60.4 33.8 29.6 95.8 9.6 95.3 6.6 0.8<br />
2001 .......................... 100.0 99.2 61.5 34.5 30.3 96.6 9.7 96.1 6.4 0.8<br />
2000 3 ......................... 100.0 99.3 61.7 33.6 31.8 96.5 9.9 96.2 4.2 0.7<br />
1999 4 ......................... 100.0 99.2 62.3 34.7 31.2 96.1 8.9 95.9 3.8 0.8<br />
1999 .......................... 100.0 98.7 61.5 34.2 30.8 96.0 8.9 95.7 3.8 1.3<br />
1998 .......................... 100.0 98.9 62.3 34.4 31.8 96.2 9.1 96.0 3.7 1.1<br />
1997 5 ......................... 100.0 99.0 64.5 34.2 33.8 96.4 9.0 96.2 3.5 1.0<br />
1996 .......................... 100.0 98.9 66.6 34.3 36.3 96.4 10.1 96.0 3.1 1.1<br />
1995 .......................... 100.0 99.1 68.7 35.2 38.4 96.6 8.9 96.4 3.6 0.9<br />
1994 6 ......................... 100.0 99.1 68.0 35.4 37.6 96.9 9.2 96.5 5.0 0.9<br />
1993 7 ......................... 100.0 98.8 66.0 32.3 (NA) 95.8 8.8 95.5 3.9 1.2<br />
1992 8 ......................... 100.0 98.9 67.8 32.7 (NA) 96.6 9.4 96.3 3.8 1.1<br />
1991 .......................... 100.0 99.1 67.7 33.1 (NA) 96.3 9.5 96.0 3.9 0.9<br />
1990 .......................... 100.0 99.1 68.3 33.2 (NA) 96.0 8.6 95.7 3.8 0.9<br />
1989 .......................... 100.0 99.0 67.7 32.0 (NA) 95.8 8.7 95.6 3.7 1.0<br />
1988 .......................... 100.0 99.1 68.4 31.6 (NA) 95.9 8.4 95.5 3.7 0.9<br />
1987 9 ......................... 100.0 98.9 70.7 31.0 (NA) 96.3 8.4 95.9 3.9 1.1<br />
(NA) Not available. Respondents were not asked detailed health insurance questions about direct-purchase coverage before the 1995 CPS ASEC.<br />
1 Military health care includes CHAMPUS (Comprehensive Health and Medical Plan for Uniformed Services)/Tricare and CHAMPVA (Civilian Health and Medical Program of the<br />
Department of Veterans Affairs), as well as care provided by the Health and Medical Program of the Department of Veterans Affairs and care provided by the Department of Veterans<br />
Affairs and the military.<br />
2 The 2004 data have been revised to reflect a correction to the weights in the 2005 ASEC. The estimates also reflect improvements to the algorithm that assigns coverage to<br />
dependents.<br />
3 Implementation of a 28,000 household sample expansion.<br />
4 Estimates reflect the results of follow-up verification questions and implementation of Census 2000-based population controls.<br />
5 Beginning with the 1998 CPS ASEC, people with no coverage other than access to Indian Health Service are no longer considered covered by health insurance; instead, they are<br />
considered to be uninsured. The effect of this change on the overall estimates of health insurance coverage is negligible; however, the decrease in the number of people covered by<br />
Medicaid may be partially due to this change.<br />
6 Health insurance questions were redesigned. Increases in estimates of employment-based and military health care coverage may be partially due to questionnaire changes.<br />
Overall coverage estimates were not affected.<br />
7 Data collection method changed from paper and pencil to computer-assisted interviewing.<br />
8 Implementation of 1990 <strong>census</strong> population controls.<br />
9 Implementation of a new CPS ASEC processing system.<br />
Source: U.S. Census Bureau, Current Population Survey, 1988 to 2006 Annual Social and Economic Supplements.<br />
U.S. Census Bureau Income, Poverty, and Health Insurance Coverage in the United States: 2005 75