census
census
census
You also want an ePaper? Increase the reach of your titles
YUMPU automatically turns print PDFs into web optimized ePapers that Google loves.
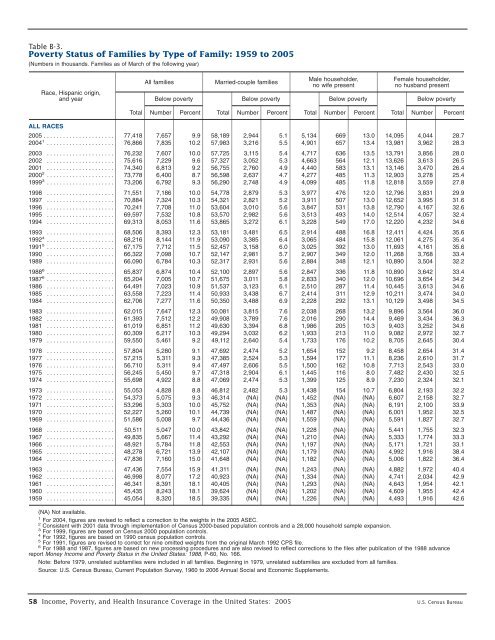
Table B-3.<br />
Poverty Status of Families by Type of Family: 1959 to 2005<br />
(Numbers in thousands. Families as of March of the following year)<br />
Race, Hispanic origin,<br />
and year<br />
All families<br />
Below poverty<br />
Married-couple families<br />
Below poverty<br />
Male householder,<br />
no wife present<br />
Below poverty<br />
Female householder,<br />
no husband present<br />
Below poverty<br />
Total<br />
Number Percent Total Number Percent Total Number Percent Total Number Percent<br />
ALL RACES<br />
2005 ...................... 77,418 7,657 9.9 58,189 2,944 5.1 5,134 669 13.0 14,095 4,044 28.7<br />
2004 1 ..................... 76,866 7,835 10.2 57,983 3,216 5.5 4,901 657 13.4 13,981 3,962 28.3<br />
2003 ..................... 76,232 7,607 10.0 57,725 3,115 5.4 4,717 636 13.5 13,791 3,856 28.0<br />
2002 ..................... 75,616 7,229 9.6 57,327 3,052 5.3 4,663 564 12.1 13,626 3,613 26.5<br />
2001 ..................... 74,340 6,813 9.2 56,755 2,760 4.9 4,440 583 13.1 13,146 3,470 26.4<br />
2000 2 ..................... 73,778 6,400 8.7 56,598 2,637 4.7 4,277 485 11.3 12,903 3,278 25.4<br />
1999 3 ..................... 73,206 6,792 9.3 56,290 2,748 4.9 4,099 485 11.8 12,818 3,559 27.8<br />
1998 ..................... 71,551 7,186 10.0 54,778 2,879 5.3 3,977 476 12.0 12,796 3,831 29.9<br />
1997 ..................... 70,884 7,324 10.3 54,321 2,821 5.2 3,911 507 13.0 12,652 3,995 31.6<br />
1996 ..................... 70,241 7,708 11.0 53,604 3,010 5.6 3,847 531 13.8 12,790 4,167 32.6<br />
1995 ..................... 69,597 7,532 10.8 53,570 2,982 5.6 3,513 493 14.0 12,514 4,057 32.4<br />
1994 ..................... 69,313 8,053 11.6 53,865 3,272 6.1 3,228 549 17.0 12,220 4,232 34.6<br />
1993 ..................... 68,506 8,393 12.3 53,181 3,481 6.5 2,914 488 16.8 12,411 4,424 35.6<br />
1992 4 ..................... 68,216 8,144 11.9 53,090 3,385 6.4 3,065 484 15.8 12,061 4,275 35.4<br />
1991 5 ..................... 67,175 7,712 11.5 52,457 3,158 6.0 3,025 392 13.0 11,693 4,161 35.6<br />
1990 ..................... 66,322 7,098 10.7 52,147 2,981 5.7 2,907 349 12.0 11,268 3,768 33.4<br />
1989 ..................... 66,090 6,784 10.3 52,317 2,931 5.6 2,884 348 12.1 10,890 3,504 32.2<br />
1988 6 ..................... 65,837 6,874 10.4 52,100 2,897 5.6 2,847 336 11.8 10,890 3,642 33.4<br />
1987 6 ..................... 65,204 7,005 10.7 51,675 3,011 5.8 2,833 340 12.0 10,696 3,654 34.2<br />
1986 ..................... 64,491 7,023 10.9 51,537 3,123 6.1 2,510 287 11.4 10,445 3,613 34.6<br />
1985 ..................... 63,558 7,223 11.4 50,933 3,438 6.7 2,414 311 12.9 10,211 3,474 34.0<br />
1984 ..................... 62,706 7,277 11.6 50,350 3,488 6.9 2,228 292 13.1 10,129 3,498 34.5<br />
1983 ..................... 62,015 7,647 12.3 50,081 3,815 7.6 2,038 268 13.2 9,896 3,564 36.0<br />
1982 ..................... 61,393 7,512 12.2 49,908 3,789 7.6 2,016 290 14.4 9,469 3,434 36.3<br />
1981 ..................... 61,019 6,851 11.2 49,630 3,394 6.8 1,986 205 10.3 9,403 3,252 34.6<br />
1980 ..................... 60,309 6,217 10.3 49,294 3,032 6.2 1,933 213 11.0 9,082 2,972 32.7<br />
1979 ..................... 59,550 5,461 9.2 49,112 2,640 5.4 1,733 176 10.2 8,705 2,645 30.4<br />
1978 ..................... 57,804 5,280 9.1 47,692 2,474 5.2 1,654 152 9.2 8,458 2,654 31.4<br />
1977 ..................... 57,215 5,311 9.3 47,385 2,524 5.3 1,594 177 11.1 8,236 2,610 31.7<br />
1976 ..................... 56,710 5,311 9.4 47,497 2,606 5.5 1,500 162 10.8 7,713 2,543 33.0<br />
1975 ..................... 56,245 5,450 9.7 47,318 2,904 6.1 1,445 116 8.0 7,482 2,430 32.5<br />
1974 ..................... 55,698 4,922 8.8 47,069 2,474 5.3 1,399 125 8.9 7,230 2,324 32.1<br />
1973 ..................... 55,053 4,828 8.8 46,812 2,482 5.3 1,438 154 10.7 6,804 2,193 32.2<br />
1972 ..................... 54,373 5,075 9.3 46,314 (NA) (NA) 1,452 (NA) (NA) 6,607 2,158 32.7<br />
1971 ..................... 53,296 5,303 10.0 45,752 (NA) (NA) 1,353 (NA) (NA) 6,191 2,100 33.9<br />
1970 ..................... 52,227 5,260 10.1 44,739 (NA) (NA) 1,487 (NA) (NA) 6,001 1,952 32.5<br />
1969 ..................... 51,586 5,008 9.7 44,436 (NA) (NA) 1,559 (NA) (NA) 5,591 1,827 32.7<br />
1968 ..................... 50,511 5,047 10.0 43,842 (NA) (NA) 1,228 (NA) (NA) 5,441 1,755 32.3<br />
1967 ..................... 49,835 5,667 11.4 43,292 (NA) (NA) 1,210 (NA) (NA) 5,333 1,774 33.3<br />
1966 ..................... 48,921 5,784 11.8 42,553 (NA) (NA) 1,197 (NA) (NA) 5,171 1,721 33.1<br />
1965 ..................... 48,278 6,721 13.9 42,107 (NA) (NA) 1,179 (NA) (NA) 4,992 1,916 38.4<br />
1964 ..................... 47,836 7,160 15.0 41,648 (NA) (NA) 1,182 (NA) (NA) 5,006 1,822 36.4<br />
1963 ..................... 47,436 7,554 15.9 41,311 (NA) (NA) 1,243 (NA) (NA) 4,882 1,972 40.4<br />
1962 ..................... 46,998 8,077 17.2 40,923 (NA) (NA) 1,334 (NA) (NA) 4,741 2,034 42.9<br />
1961 ..................... 46,341 8,391 18.1 40,405 (NA) (NA) 1,293 (NA) (NA) 4,643 1,954 42.1<br />
1960 ..................... 45,435 8,243 18.1 39,624 (NA) (NA) 1,202 (NA) (NA) 4,609 1,955 42.4<br />
1959 ..................... 45,054 8,320 18.5 39,335 (NA) (NA) 1,226 (NA) (NA) 4,493 1,916 42.6<br />
(NA) Not available.<br />
1 For 2004, figures are revised to reflect a correction to the weights in the 2005 ASEC.<br />
2 Consistent with 2001 data through implementation of Census 2000-based population controls and a 28,000 household sample expansion.<br />
3 For 1999, figures are based on Census 2000 population controls.<br />
4 For 1992, figures are based on 1990 <strong>census</strong> population controls.<br />
5 For 1991, figures are revised to correct for nine omitted weights from the original March 1992 CPS file.<br />
6 For 1988 and 1987, figures are based on new processing procedures and are also revised to reflect corrections to the files after publication of the 1988 advance<br />
report Money Income and Poverty Status in the United States: 1988, P-60, No. 166.<br />
Note: Before 1979, unrelated subfamilies were included in all families. Beginning in 1979, unrelated subfamilies are excluded from all families.<br />
Source: U.S. Census Bureau, Current Population Survey, 1960 to 2006 Annual Social and Economic Supplements.<br />
58 Income, Poverty, and Health Insurance Coverage in the United States: 2005 U.S. Census Bureau


