census
census
census

Create successful ePaper yourself
Turn your PDF publications into a flip-book with our unique Google optimized e-Paper software.
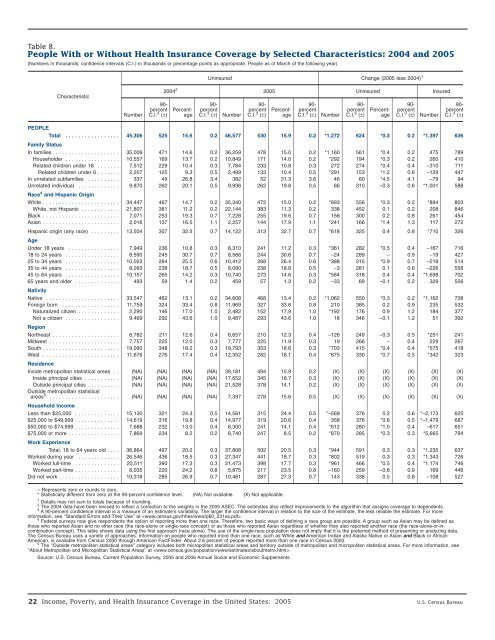
Table 8.<br />
People With or Without Health Insurance Coverage by Selected Characteristics: 2004 and 2005<br />
(Numbers in thousands, confidence intervals (C.I.) in thousands or percentage points as appropriate. People as of March of the following year)<br />
Uninsured<br />
Change (2005 less<br />
1<br />
2004)<br />
Characteristic<br />
Number<br />
90-<br />
percent<br />
C.I. 3 (±)<br />
2004 2 2005<br />
Uninsured<br />
Insured<br />
Percentage<br />
90-<br />
percent<br />
C.I. 3 (±)<br />
Number<br />
90-<br />
percent<br />
C.I. 3 (±)<br />
Percentage<br />
90-<br />
percent<br />
C.I. 3 (±)<br />
Number<br />
90-<br />
percent<br />
C.I. 3 (±)<br />
Percentage<br />
90-<br />
percent<br />
C.I. 3 (±)<br />
Number<br />
90-<br />
percent<br />
C.I. 3 (±)<br />
PEOPLE<br />
Total ................. 45,306 525 15.6 0.2 46,577 530 15.9 0.2 *1,272 624 *0.3 0.2 *1,397 636<br />
Family Status<br />
In families .................... 35,009 471 14.6 0.2 36,259 478 15.0 0.2 *1,160 561 *0.4 0.2 475 789<br />
Householder ................. 10,557 169 13.7 0.2 10,849 171 14.0 0.2 *292 194 *0.3 0.2 260 410<br />
Related children under 18 ....... 7,512 229 10.4 0.3 7,784 233 10.8 0.3 272 274 *0.4 0.4 –310 711<br />
Related children under 6 ....... 2,207 125 9.3 0.5 2,499 133 10.4 0.5 *291 153 *1.2 0.6 –129 447<br />
In unrelated subfamilies .......... 337 49 26.8 3.4 382 52 31.3 3.6 46 60 *4.5 4.1 –79 94<br />
Unrelated individual ............. 9,870 262 20.1 0.5 9,936 262 19.8 0.5 66 310 –0.3 0.6 *1,001 588<br />
Race 4 and Hispanic Origin<br />
White ........................ 34,447 467 14.7 0.2 35,340 472 15.0 0.2 *893 556 *0.3 0.2 *894 803<br />
White, not Hispanic ............ 21,807 381 11.2 0.2 22,144 383 11.3 0.2 338 452 0.1 0.2 208 846<br />
Black ........................ 7,071 253 19.3 0.7 7,228 255 19.6 0.7 156 300 0.2 0.8 261 454<br />
Asian ........................ 2,016 137 16.5 1.1 2,257 144 17.9 1.1 *241 166 *1.4 1.3 117 272<br />
Hispanic origin (any race) ......... 13,504 307 32.3 0.7 14,122 313 32.7 0.7 *618 325 0.4 0.8 *710 326<br />
Age<br />
Under 18 years ................ 7,949 236 10.8 0.3 8,310 241 11.2 0.3 *361 282 *0.5 0.4 –167 716<br />
18 to 24 years ................. 8,590 245 30.7 0.7 8,566 244 30.6 0.7 –24 289 – 0.9 –19 427<br />
25 to 34 years ................. 10,023 264 25.5 0.6 10,412 268 26.4 0.6 *388 315 *0.9 0.7 –218 514<br />
35 to 44 years ................. 8,093 238 18.7 0.5 8,090 238 18.8 0.5 –3 281 0.1 0.6 –226 558<br />
45 to 64 years ................. 10,157 265 14.2 0.3 10,740 273 14.6 0.3 *584 318 0.4 0.4 *1,698 702<br />
65 years and older .............. 493 59 1.4 0.2 459 57 1.3 0.2 –33 69 –0.1 0.2 329 556<br />
Nativity<br />
Native ....................... 33,547 462 13.1 0.2 34,608 468 13.4 0.2 *1,062 550 *0.3 0.2 *1,162 738<br />
Foreign born .................. 11,759 324 33.4 0.8 11,969 327 33.6 0.8 210 385 0.2 0.9 235 532<br />
Naturalized citizen ............. 2,290 146 17.0 1.0 2,482 152 17.9 1.0 *192 176 0.9 1.2 184 377<br />
Not a citizen ................. 9,469 292 43.6 1.0 9,487 293 43.6 1.0 18 346 –0.1 1.2 51 392<br />
Region<br />
Northeast ..................... 6,782 211 12.6 0.4 6,657 210 12.3 0.4 –126 249 –0.3 0.5 *251 241<br />
Midwest ...................... 7,757 225 12.0 0.3 7,777 225 11.9 0.3 19 266 – 0.4 229 267<br />
South........................ 19,090 348 18.2 0.3 19,793 353 18.6 0.3 *703 415 *0.4 0.4 *575 418<br />
West ........................ 11,676 276 17.4 0.4 12,352 282 18.1 0.4 *675 330 *0.7 0.5 *342 323<br />
Residence<br />
Inside metropolitan statistical areas . . (NA) (NA) (NA) (NA) 39,181 494 15.9 0.2 (X) (X) (X) (X) (X) (X)<br />
Inside principal cities ........... (NA) (NA) (NA) (NA) 17,652 345 18.7 0.3 (X) (X) (X) (X) (X) (X)<br />
Outside principal cities .......... (NA) (NA) (NA) (NA) 21,528 378 14.1 0.2 (X) (X) (X) (X) (X) (X)<br />
Outside metropolitan statistical<br />
areas 5 ...................... (NA) (NA) (NA) (NA) 7,397 278 15.6 0.5 (X) (X) (X) (X) (X) (X)<br />
Household Income<br />
Less than $25,000 .............. 15,130 321 24.3 0.5 14,561 315 24.4 0.5 *–569 376 0.2 0.6 *–2,173 625<br />
$25,000 to $49,999 .............. 14,619 316 19.8 0.4 14,977 319 20.6 0.4 358 376 *0.8 0.5 *–1,479 687<br />
$50,000 to $74,999 .............. 7,688 232 13.0 0.4 8,300 241 14.1 0.4 *612 280 *1.0 0.4 –617 651<br />
$75,000 or more ................ 7,869 234 8.2 0.2 8,740 247 8.5 0.2 *870 285 *0.3 0.3 *5,665 794<br />
Work Experience<br />
Total,18to64yearsold.... 36,864 497 20.2 0.3 37,808 502 20.5 0.3 *944 591 0.3 0.3 *1,235 637<br />
Worked during year ............. 26,546 436 18.5 0.3 27,347 441 18.7 0.3 *802 519 0.3 0.3 *1,343 726<br />
Worked full-time .............. 20,511 390 17.3 0.3 21,473 398 17.7 0.3 *961 466 *0.5 0.4 *1,174 746<br />
Worked part-time .............. 6,035 220 24.2 0.8 5,875 217 23.5 0.8 –160 259 –0.6 0.9 169 446<br />
Did not work ................... 10,318 285 26.9 0.7 10,461 287 27.3 0.7 143 338 0.5 0.8 –108 527<br />
– Represents zero or rounds to zero.<br />
* Statistically different from zero at the 90-percent confidence level. (NA) Not available. (X) Not applicable.<br />
1 Details may not sum to totals because of rounding.<br />
2 The 2004 data have been revised to reflect a correction to the weights in the 2005 ASEC. The estimates also reflect improvements to the algorithm that assigns coverage to dependents.<br />
3 A 90-percent confidence interval is a measure of an estimate’s variability. The larger the confidence interval in relation to the size of the estimate, the less reliable the estimate. For more<br />
information, see ‘‘Standard Errors and Their Use’’ at .<br />
4 Federal surveys now give respondents the option of reporting more than one race. Therefore, two basic ways of defining a race group are possible. A group such as Asian may be defined as<br />
those who reported Asian and no other race (the race-alone or single-race concept) or as those who reported Asian regardless of whether they also reported another race (the race-alone-or-incombination<br />
concept). This table shows data using the first approach (race alone). The use of the single-race population does not imply that it is the preferred method of presenting or analyzing data.<br />
The Census Bureau uses a variety of approaches. Information on people who reported more than one race, such as White and American Indian and Alaska Native or Asian and Black or African<br />
American, is available from Census 2000 through American FactFinder. About 2.6 percent of people reported more than one race in Census 2000.<br />
5 The ‘‘Outside metropolitan statistical areas’’ category includes both micropolitan statistical areas and territory outside of metropolitan and micropolitan statistical areas. For more information, see<br />
‘‘About Metropolitan and Micropolitan Statistical Areas’’ at .<br />
Source: U.S. Census Bureau, Current Population Survey, 2005 and 2006 Annual Social and Economic Supplements.<br />
22 Income, Poverty, and Health Insurance Coverage in the United States: 2005 U.S. Census Bureau