census
census
census

Create successful ePaper yourself
Turn your PDF publications into a flip-book with our unique Google optimized e-Paper software.
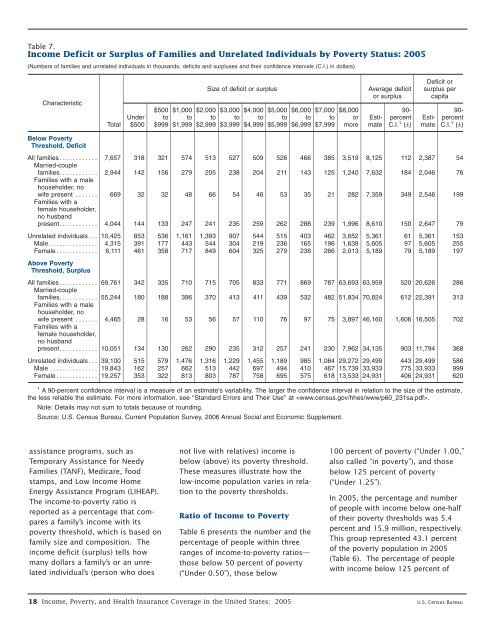
Table 7.<br />
Income Deficit or Surplus of Families and Unrelated Individuals by Poverty Status: 2005<br />
(Numbers of families and unrelated individuals in thousands, deficits and surpluses and their confidence intervals (C.I.) in dollars)<br />
Characteristic<br />
Total<br />
Under<br />
$500<br />
$500<br />
to<br />
$999<br />
$1,000<br />
to<br />
$1,999<br />
Size of deficit or surplus<br />
$2,000<br />
to<br />
$2,999<br />
$3,000<br />
to<br />
$3,999<br />
$4,000<br />
to<br />
$4,999<br />
$5,000<br />
to<br />
$5,999<br />
$6,000<br />
to<br />
$6,999<br />
$7,000<br />
to<br />
$7,999<br />
$8,000<br />
or<br />
more<br />
Average deficit<br />
or surplus<br />
Estimate<br />
90-<br />
percent<br />
C.I. 1 (±)<br />
Deficit or<br />
surplus per<br />
capita<br />
Estimate<br />
90-<br />
percent<br />
C.I. 1 (±)<br />
Below Poverty<br />
Threshold, Deficit<br />
All families . . . ......... 7,657 318 321 574 513 527 509 526 466 385 3,519 8,125 112 2,387 54<br />
Married-couple<br />
families. . . . . ....... 2,944 142 156 279 205 238 204 211 143 125 1,240 7,632 184 2,046 76<br />
Families with a male<br />
householder, no<br />
wife present . . . . . . . 669 32 32 48 66 54 46 53 35 21 282 7,359 349 2,546 199<br />
Families with a<br />
female householder,<br />
no husband<br />
present. . . ......... 4,044 144 133 247 241 235 259 262 288 239 1,996 8,610 150 2,647 79<br />
Unrelated individuals . . . 10,425 853 536 1,161 1,393 907 544 515 403 462 3,652 5,361 61 5,361 153<br />
Male . . . ............ 4,315 391 177 443 544 304 219 236 165 196 1,639 5,605 97 5,605 255<br />
Female . . . .......... 6,111 461 358 717 849 604 325 279 238 266 2,013 5,189 79 5,189 197<br />
Above Poverty<br />
Threshold, Surplus<br />
All families . . . ......... 69,761 342 335 710 715 705 833 771 869 787 63,693 63,959 520 20,626 286<br />
Married-couple<br />
families. . . . . ....... 55,244 180 188 396 370 413 411 439 532 482 51,834 70,824 612 22,391 313<br />
Families with a male<br />
householder, no<br />
wife present . . . . . . . 4,465 28 16 53 56 57 110 76 97 75 3,897 46,160 1,606 16,505 702<br />
Families with a<br />
female householder,<br />
no husband<br />
present. . . ......... 10,051 134 130 262 290 235 312 257 241 230 7,962 34,135 903 11,794 368<br />
Unrelated individuals . . . 39,100 515 579 1,476 1,316 1,229 1,455 1,189 985 1,084 29,272 29,499 443 29,499 586<br />
Male . . . ............ 19,843 162 257 662 513 442 697 494 410 467 15,739 33,933 775 33,933 999<br />
Female . . . .......... 19,257 353 322 813 803 787 758 695 575 618 13,533 24,931 406 24,931 620<br />
1 A 90-percent confidence interval is a measure of an estimate’s variability. The larger the confidence interval in relation to the size of the estimate,<br />
the less reliable the estimate. For more information, see ‘‘Standard Errors and Their Use’’ at .<br />
Note: Details may not sum to totals because of rounding.<br />
Source: U.S. Census Bureau, Current Population Survey, 2006 Annual Social and Economic Supplement.<br />
assistance programs, such as<br />
Temporary Assistance for Needy<br />
Families (TANF), Medicare, food<br />
stamps, and Low Income Home<br />
Energy Assistance Program (LIHEAP).<br />
The income-to-poverty ratio is<br />
reported as a percentage that compares<br />
a family’s income with its<br />
poverty threshold, which is based on<br />
family size and composition. The<br />
income deficit (surplus) tells how<br />
many dollars a family’s or an unrelated<br />
individual’s (person who does<br />
not live with relatives) income is<br />
below (above) its poverty threshold.<br />
These measures illustrate how the<br />
low-income population varies in relation<br />
to the poverty thresholds.<br />
Ratio of Income to Poverty<br />
Table 6 presents the number and the<br />
percentage of people within three<br />
ranges of income-to-poverty ratios—<br />
those below 50 percent of poverty<br />
(“Under 0.50”), those below<br />
100 percent of poverty (“Under 1.00,”<br />
also called “in poverty”), and those<br />
below 125 percent of poverty<br />
(“Under 1.25”).<br />
In 2005, the percentage and number<br />
of people with income below one-half<br />
of their poverty thresholds was 5.4<br />
percent and 15.9 million, respectively.<br />
This group represented 43.1 percent<br />
of the poverty population in 2005<br />
(Table 6). The percentage of people<br />
with income below 125 percent of<br />
18 Income, Poverty, and Health Insurance Coverage in the United States: 2005 U.S. Census Bureau