census
census
census

You also want an ePaper? Increase the reach of your titles
YUMPU automatically turns print PDFs into web optimized ePapers that Google loves.
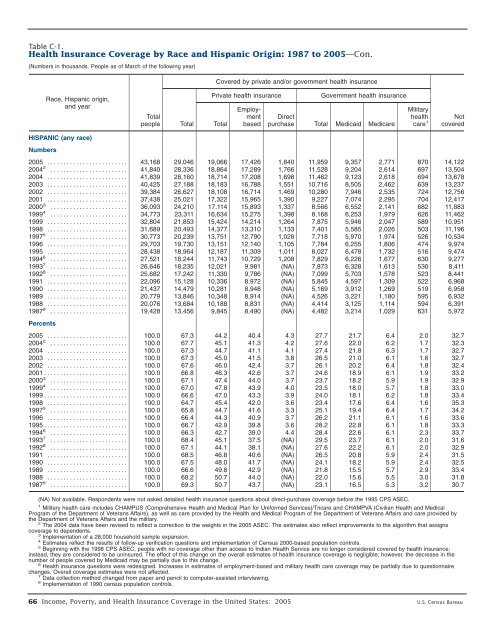
Table C-1.<br />
Health Insurance Coverage by Race and Hispanic Origin: 1987 to 2005—Con.<br />
(Numbers in thousands. People as of March of the following year)<br />
Covered by private and/or government health insurance<br />
Race, Hispanic origin,<br />
and year<br />
Total<br />
people<br />
Total<br />
Private health insurance<br />
Total<br />
Employment<br />
based<br />
Government health insurance<br />
Direct<br />
purchase Total Medicaid Medicare<br />
Military<br />
health<br />
care 1<br />
Not<br />
covered<br />
HISPANIC (any race)<br />
Numbers<br />
2005 . . . . . . . . ................. 43,168 29,046 19,066 17,426 1,840 11,959 9,357 2,771 870 14,122<br />
2004 2 ........................ 41,840 28,336 18,864 17,289 1,766 11,528 9,204 2,614 697 13,504<br />
2004 . . . . . . . . . . . . . . . . . . . . . . . . . 41,839 28,160 18,714 17,208 1,698 11,462 9,123 2,618 694 13,678<br />
2003 . . . . . . . . . . . . . . . . . . . . . . . . . 40,425 27,188 18,183 16,788 1,551 10,716 8,505 2,462 639 13,237<br />
2002 . . . . . . . . . . . . . . . . . . . . . . . . . 39,384 26,627 18,108 16,714 1,469 10,280 7,946 2,535 724 12,756<br />
2001 . . . . . . . . . . . . . . . . . . . . . . . . . 37,438 25,021 17,322 15,965 1,390 9,227 7,074 2,295 704 12,417<br />
2000 3 ........................ 36,093 24,210 17,114 15,893 1,337 8,566 6,552 2,141 682 11,883<br />
1999 4 ........................ 34,773 23,311 16,634 15,275 1,398 8,168 6,253 1,979 626 11,462<br />
1999 . . . . . . . . . . . . . . . . . . . . . . . . . 32,804 21,853 15,424 14,214 1,264 7,875 5,946 2,047 589 10,951<br />
1998 . . . . . . . . . . . . . . . . . . . . . . . . . 31,689 20,493 14,377 13,310 1,133 7,401 5,585 2,026 503 11,196<br />
1997 5 ........................ 30,773 20,239 13,751 12,790 1,028 7,718 5,970 1,974 526 10,534<br />
1996 . . . . . . . . . . . . . . . . . . . . . . . . . 29,703 19,730 13,151 12,140 1,105 7,784 6,255 1,806 474 9,974<br />
1995 . . . . . . . . . . . . . . . . . . . . . . . . . 28,438 18,964 12,187 11,309 1,011 8,027 6,478 1,732 516 9,474<br />
1994 6 ........................ 27,521 18,244 11,743 10,729 1,208 7,829 6,226 1,677 630 9,277<br />
1993 7 ........................ 26,646 18,235 12,021 9,981 (NA) 7,873 6,328 1,613 530 8,411<br />
1992 8 ........................ 25,682 17,242 11,330 9,786 (NA) 7,099 5,703 1,578 523 8,441<br />
1991 . . . . . . . . . . . . . . . . . . . . . . . . . 22,096 15,128 10,336 8,972 (NA) 5,845 4,597 1,309 522 6,968<br />
1990 . . . . . . . . . . . . . . . . . . . . . . . . . 21,437 14,479 10,281 8,948 (NA) 5,169 3,912 1,269 519 6,958<br />
1989 . . . . . . . . . . . . . . . . . . . . . . . . . 20,779 13,846 10,348 8,914 (NA) 4,526 3,221 1,180 595 6,932<br />
1988 . . . . . . . . . . . . . . . . . . . . . . . . . 20,076 13,684 10,188 8,831 (NA) 4,414 3,125 1,114 594 6,391<br />
1987 9 ........................ 19,428 13,456 9,845 8,490 (NA) 4,482 3,214 1,029 631 5,972<br />
Percents<br />
2005 . . . . . . . . ................. 100.0 67.3 44.2 40.4 4.3 27.7 21.7 6.4 2.0 32.7<br />
2004 2 ........................ 100.0 67.7 45.1 41.3 4.2 27.6 22.0 6.2 1.7 32.3<br />
2004 . . . . . . . . . . . . . . . . . . . . . . . . . 100.0 67.3 44.7 41.1 4.1 27.4 21.8 6.3 1.7 32.7<br />
2003 . . . . . . . . . . . . . . . . . . . . . . . . . 100.0 67.3 45.0 41.5 3.8 26.5 21.0 6.1 1.6 32.7<br />
2002 . . . . . . . . . . . . . . . . . . . . . . . . . 100.0 67.6 46.0 42.4 3.7 26.1 20.2 6.4 1.8 32.4<br />
2001 . . . . . . . . . . . . . . . . . . . . . . . . . . 100.0 66.8 46.3 42.6 3.7 24.6 18.9 6.1 1.9 33.2<br />
2000 3 ........................ 100.0 67.1 47.4 44.0 3.7 23.7 18.2 5.9 1.9 32.9<br />
1999 4 ........................ 100.0 67.0 47.8 43.9 4.0 23.5 18.0 5.7 1.8 33.0<br />
1999 . . . . . . . . . . . . . . . . . . . . . . . . . . 100.0 66.6 47.0 43.3 3.9 24.0 18.1 6.2 1.8 33.4<br />
1998 . . . . . . . . . . . . . . . . . . . . . . . . . 100.0 64.7 45.4 42.0 3.6 23.4 17.6 6.4 1.6 35.3<br />
1997 5 ........................ 100.0 65.8 44.7 41.6 3.3 25.1 19.4 6.4 1.7 34.2<br />
1996 . . . . . . . . . . . . . . . . . . . . . . . . . 100.0 66.4 44.3 40.9 3.7 26.2 21.1 6.1 1.6 33.6<br />
1995 . . . . . . . . . . . . . . . . . . . . . . . . . . 100.0 66.7 42.9 39.8 3.6 28.2 22.8 6.1 1.8 33.3<br />
1994 6 ........................ 100.0 66.3 42.7 39.0 4.4 28.4 22.6 6.1 2.3 33.7<br />
1993 7 ........................ 100.0 68.4 45.1 37.5 (NA) 29.5 23.7 6.1 2.0 31.6<br />
1992 8 ........................ 100.0 67.1 44.1 38.1 (NA) 27.6 22.2 6.1 2.0 32.9<br />
1991 . . . . . . . . . . . . . . . . . . . . . . . . . 100.0 68.5 46.8 40.6 (NA) 26.5 20.8 5.9 2.4 31.5<br />
1990 . . . . . . . . . . . . . . . . . . . . . . . . . 100.0 67.5 48.0 41.7 (NA) 24.1 18.2 5.9 2.4 32.5<br />
1989 . . . . . . . . . . . . . . . . . . . . . . . . . 100.0 66.6 49.8 42.9 (NA) 21.8 15.5 5.7 2.9 33.4<br />
1988 . . . . . . . . . . . . . . . . . . . . . . . . . 100.0 68.2 50.7 44.0 (NA) 22.0 15.6 5.5 3.0 31.8<br />
1987 9 ........................ 100.0 69.3 50.7 43.7 (NA) 23.1 16.5 5.3 3.2 30.7<br />
(NA) Not available. Respondents were not asked detailed health insurance questions about direct-purchase coverage before the 1995 CPS ASEC.<br />
1 Military health care includes CHAMPUS (Comprehensive Health and Medical Plan for Uniformed Services)/Tricare and CHAMPVA (Civilian Health and Medical<br />
Program of the Department of Veterans Affairs), as well as care provided by the Health and Medical Program of the Department of Veterans Affairs and care provided by<br />
the Department of Veterans Affairs and the military.<br />
2 The 2004 data have been revised to reflect a correction to the weights in the 2005 ASEC. The estimates also reflect improvements to the algorithm that assigns<br />
coverage to dependents.<br />
3 Implementation of a 28,000 household sample expansion.<br />
4 Estimates reflect the results of follow-up verification questions and implementation of Census 2000-based population controls.<br />
5 Beginning with the 1998 CPS ASEC, people with no coverage other than access to Indian Health Service are no longer considered covered by health insurance;<br />
instead, they are considered to be uninsured. The effect of this change on the overall estimates of health insurance coverage is negligible; however, the decrease in the<br />
number of people covered by Medicaid may be partially due to this change.<br />
6 Health insurance questions were redesigned. Increases in estimates of employment-based and military health care coverage may be partially due to questionnaire<br />
changes. Overall coverage estimates were not affected.<br />
7 Data collection method changed from paper and pencil to computer-assisted interviewing.<br />
8 Implementation of 1990 <strong>census</strong> population controls.<br />
66 Income, Poverty, and Health Insurance Coverage in the United States: 2005 U.S. Census Bureau