

Hydrogeology and Groundwater Quality of Highlands ... - USGS
Hydrogeology and Groundwater Quality of Highlands ... - USGS
Hydrogeology and Groundwater Quality of Highlands ... - USGS

Create successful ePaper yourself
Turn your PDF publications into a flip-book with our unique Google optimized e-Paper software.
Table 1. Results <strong>of</strong> trend anaysis for rainfall stations <strong>and</strong> long-term observation wells in Highl<strong>and</strong>s County.<br />
evapotranspiration, defined as the combined processes <strong>of</strong><br />
evaporation <strong>of</strong> water from l<strong>and</strong> <strong>and</strong> water surfaces <strong>and</strong><br />
transpiration by plants. The rate <strong>of</strong> evapotranspiration is<br />
controlled by several factors, primarily net solar radiation,<br />
wind speed, relative humidity, surface area <strong>of</strong> open water<br />
bodies, density <strong>and</strong> type <strong>of</strong> vegetation cover, available<br />
soil moisture, root depth, water-table depth, <strong>and</strong> season.<br />
The term potential evapotranspiration is a measure <strong>of</strong> the<br />
ability <strong>of</strong> the atmosphere to remove water from the surface<br />
through the processes <strong>of</strong> evaporation <strong>and</strong> transpiration<br />
assuming no limit on water supply. Actual evapotranspiration<br />
is the quantity <strong>of</strong> water that is actually removed from<br />
a surface due to the processes <strong>of</strong> evaporation <strong>and</strong> transpiration.<br />
Actual evapotranspiration is always less than or equal<br />
to potential evapotranspiration.<br />
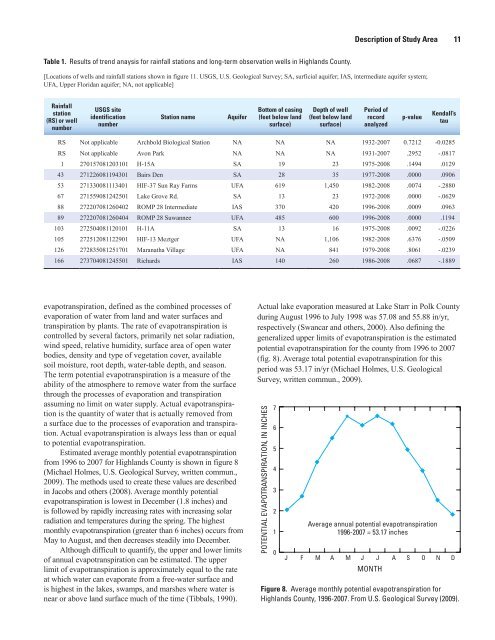
Estimated average monthly potential evapotranspiration<br />
from 1996 to 2007 for Highl<strong>and</strong>s County is shown in figure 8<br />
(Michael Holmes, U.S. Geological Survey, written commun.,<br />
2009). The methods used to create these values are described<br />
in Jacobs <strong>and</strong> others (2008). Average monthly potential<br />
evapotranspiration is lowest in December (1.8 inches) <strong>and</strong><br />
is followed by rapidly increasing rates with increasing solar<br />
radiation <strong>and</strong> temperatures during the spring. The highest<br />
monthly evapotranspiration (greater than 6 inches) occurs from<br />
May to August, <strong>and</strong> then decreases steadily into December.<br />
Although difficult to quantify, the upper <strong>and</strong> lower limits<br />
<strong>of</strong> annual evapotranspiration can be estimated. The upper<br />
limit <strong>of</strong> evapotranspiration is approximately equal to the rate<br />
at which water can evaporate from a free-water surface <strong>and</strong><br />
is highest in the lakes, swamps, <strong>and</strong> marshes where water is<br />
near or above l<strong>and</strong> surface much <strong>of</strong> the time (Tibbals, 1990).<br />
Description <strong>of</strong> Study Area 11<br />
[Locations <strong>of</strong> wells <strong>and</strong> rainfall stations shown in figure 11. <strong>USGS</strong>, U.S. Geological Survey; SA, surficial aquifer; IAS, intermediate aquifer system;<br />
UFA, Upper Floridan aquifer; NA, not applicable]<br />
Rainfall<br />
station<br />
(RS) or well<br />
number<br />
<strong>USGS</strong> site<br />
identification<br />
number<br />
Station name Aquifer<br />
Bottom <strong>of</strong> casing<br />
(feet below l<strong>and</strong><br />
surface)<br />
Depth <strong>of</strong> well<br />
(feet below l<strong>and</strong><br />
surface)<br />
Period <strong>of</strong><br />
record<br />
analyzed<br />
p-value<br />
Kendall’s<br />
tau<br />
RS Not applicable Archbold Biological Station NA NA NA 1932-2007 0.7212 -0.0285<br />
RS Not applicable Avon Park NA NA NA 1931-2007 .2952 -.0817<br />
1 270157081203101 H-15A SA 19 23 1975-2008 .1494 .0129<br />
43 271226081194301 Bairs Den SA 28 35 1977-2008 .0000 .0906<br />
53 271330081113401 HIF-37 Sun Ray Farms UFA 619 1,450 1982-2008 .0074 -.2880<br />
67 271559081242501 Lake Grove Rd. SA 13 23 1972-2008 .0000 -.0629<br />
88 272207081260402 ROMP 28 Intermediate IAS 370 420 1996-2008 .0009 .0963<br />
89 272207081260404 ROMP 28 Suwannee UFA 485 600 1996-2008 .0000 .1194<br />
103 272504081120101 H-11A SA 13 16 1975-2008 .0092 -.0226<br />
105 272512081122901 HIF-13 Meztger UFA NA 1,106 1982-2008 .6376 -.0509<br />
126 272835081251701 Maranatha Village UFA NA 841 1979-2008 .8061 -.0239<br />
166 273704081245501 Richards IAS 140 260 1986-2008 .0687 -.1889<br />
Actual lake evaporation measured at Lake Starr in Polk County<br />
during August 1996 to July 1998 was 57.08 <strong>and</strong> 55.88 in/yr,<br />
respectively (Swancar <strong>and</strong> others, 2000). Also defining the<br />
generalized upper limits <strong>of</strong> evapotranspiration is the estimated<br />
potential evapotranspiration for the county from 1996 to 2007<br />
(fig. 8). Average total potential evapotranspiration for this<br />
period was 53.17 in/yr (Michael Holmes, U.S. Geological<br />
Survey, written commun., 2009).<br />
POTENTIAL EVAPOTRANSPIRATION, IN INCHES<br />
7<br />
6<br />
5<br />
4<br />
3<br />
2<br />
1<br />
0<br />
Average annual potential evapotranspiration<br />
1996-2007 = 53.17 inches<br />
J F M A M J J A S O N D<br />
MONTH<br />
Figure 8. Average monthly potential evapotranspiration for<br />
Highl<strong>and</strong>s County, 1996-2007. From U.S. Geological Survey (2009).


