Biomechanical P ... Slalom Water Skiing R1.pdf - Atrium - University ...
Biomechanical P ... Slalom Water Skiing R1.pdf - Atrium - University ...
Biomechanical P ... Slalom Water Skiing R1.pdf - Atrium - University ...
- No tags were found...
Create successful ePaper yourself
Turn your PDF publications into a flip-book with our unique Google optimized e-Paper software.
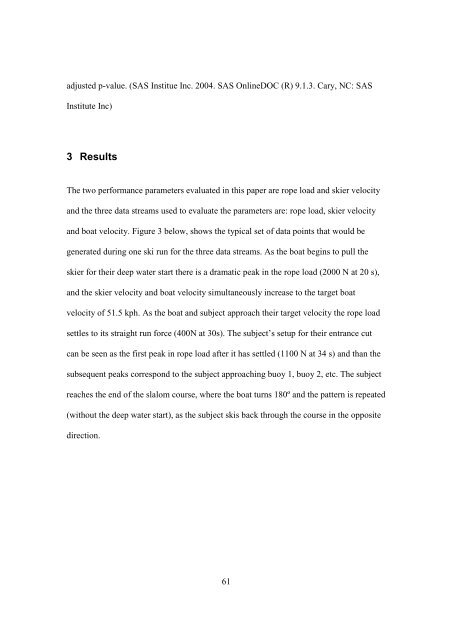
adjusted p-value. (SAS Institue Inc. 2004. SAS OnlineDOC (R) 9.1.3. Cary, NC: SASInstitute Inc)3 ResultsThe two performance parameters evaluated in this paper are rope load and skier velocityand the three data streams used to evaluate the parameters are: rope load, skier velocityand boat velocity. Figure 3 below, shows the typical set of data points that would begenerated during one ski run for the three data streams. As the boat begins to pull theskier for their deep water start there is a dramatic peak in the rope load (2000 N at 20 s),and the skier velocity and boat velocity simultaneously increase to the target boatvelocity of 51.5 kph. As the boat and subject approach their target velocity the rope loadsettles to its straight run force (400N at 30s). The subject’s setup for their entrance cutcan be seen as the first peak in rope load after it has settled (1100 N at 34 s) and than thesubsequent peaks correspond to the subject approaching buoy 1, buoy 2, etc. The subjectreaches the end of the slalom course, where the boat turns 180º and the pattern is repeated(without the deep water start), as the subject skis back through the course in the oppositedirection.61


