Biomechanical P ... Slalom Water Skiing R1.pdf - Atrium - University ...
Biomechanical P ... Slalom Water Skiing R1.pdf - Atrium - University ...
Biomechanical P ... Slalom Water Skiing R1.pdf - Atrium - University ...
- No tags were found...
Create successful ePaper yourself
Turn your PDF publications into a flip-book with our unique Google optimized e-Paper software.
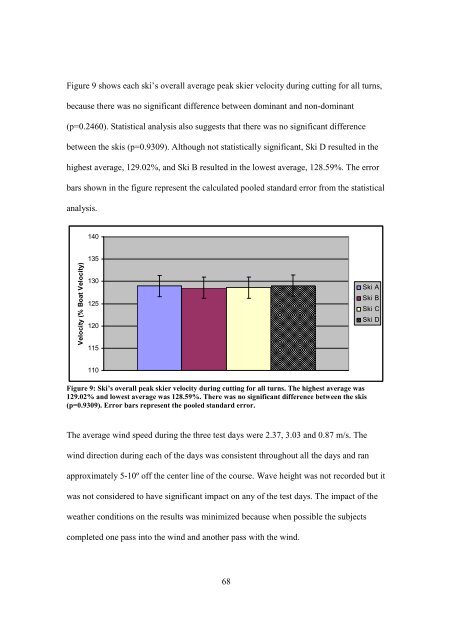
Figure 9 shows each ski’s overall average peak skier velocity during cutting for all turns,because there was no significant difference between dominant and non-dominant(p=0.2460). Statistical analysis also suggests that there was no significant differencebetween the skis (p=0.9309). Although not statistically significant, Ski D resulted in thehighest average, 129.02%, and Ski B resulted in the lowest average, 128.59%. The errorbars shown in the figure represent the calculated pooled standard error from the statisticalanalysis.140Velocity (% Boat Velocity)135130125120115Ski ASki BSki CSki D110Figure 9: Ski’s overall peak skier velocity during cutting for all turns. The highest average was129.02% and lowest average was 128.59%. There was no significant difference between the skis(p=0.9309). Error bars represent the pooled standard error.The average wind speed during the three test days were 2.37, 3.03 and 0.87 m/s. Thewind direction during each of the days was consistent throughout all the days and ranapproximately 5-10º off the center line of the course. Wave height was not recorded but itwas not considered to have significant impact on any of the test days. The impact of theweather conditions on the results was minimized because when possible the subjectscompleted one pass into the wind and another pass with the wind.68


