Biomechanical P ... Slalom Water Skiing R1.pdf - Atrium - University ...
Biomechanical P ... Slalom Water Skiing R1.pdf - Atrium - University ...
Biomechanical P ... Slalom Water Skiing R1.pdf - Atrium - University ...
- No tags were found...

Create successful ePaper yourself
Turn your PDF publications into a flip-book with our unique Google optimized e-Paper software.
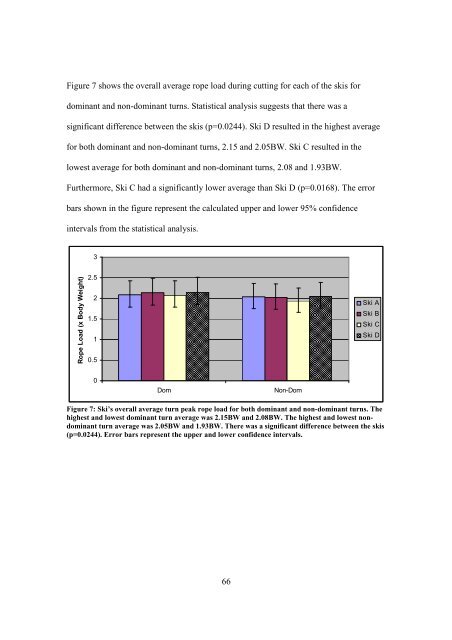
Figure 7 shows the overall average rope load during cutting for each of the skis fordominant and non-dominant turns. Statistical analysis suggests that there was asignificant difference between the skis (p=0.0244). Ski D resulted in the highest averagefor both dominant and non-dominant turns, 2.15 and 2.05BW. Ski C resulted in thelowest average for both dominant and non-dominant turns, 2.08 and 1.93BW.Furthermore, Ski C had a significantly lower average than Ski D (p=0.0168). The errorbars shown in the figure represent the calculated upper and lower 95% confidenceintervals from the statistical analysis.3Rope Load (x Body Weight)2.521.510.5Ski ASki BSki CSki D0Dom Non-DomFigure 7: Ski’s overall average turn peak rope load for both dominant and non-dominant turns. Thehighest and lowest dominant turn average was 2.15BW and 2.08BW. The highest and lowest nondominantturn average was 2.05BW and 1.93BW. There was a significant difference between the skis(p=0.0244). Error bars represent the upper and lower confidence intervals.66