Kenya OVC-CT Programme Operational and Impact Evaluation
Kenya OVC-CT Programme Operational and Impact Evaluation
Kenya OVC-CT Programme Operational and Impact Evaluation
You also want an ePaper? Increase the reach of your titles
YUMPU automatically turns print PDFs into web optimized ePapers that Google loves.
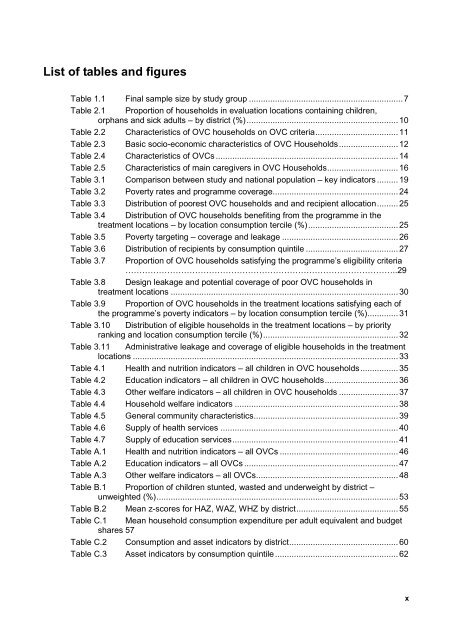
List of tables <strong>and</strong> figuresTable 1.1 Final sample size by study group ................................................................. 7Table 2.1 Proportion of households in evaluation locations containing children,orphans <strong>and</strong> sick adults – by district (%)................................................................ 10Table 2.2 Characteristics of <strong>OVC</strong> households on <strong>OVC</strong> criteria ................................... 11Table 2.3 Basic socio-economic characteristics of <strong>OVC</strong> Households ......................... 12Table 2.4 Characteristics of <strong>OVC</strong>s ............................................................................. 14Table 2.5 Characteristics of main caregivers in <strong>OVC</strong> Households .............................. 16Table 3.1 Comparison between study <strong>and</strong> national population – key indicators ......... 19Table 3.2 Poverty rates <strong>and</strong> programme coverage ..................................................... 24Table 3.3 Distribution of poorest <strong>OVC</strong> households <strong>and</strong> <strong>and</strong> recipient allocation ......... 25Table 3.4 Distribution of <strong>OVC</strong> households benefiting from the programme in thetreatment locations – by location consumption tercile (%)...................................... 25Table 3.5 Poverty targeting – coverage <strong>and</strong> leakage ................................................. 26Table 3.6 Distribution of recipients by consumption quintile ....................................... 27Table 3.7 Proportion of <strong>OVC</strong> households satisfying the programme’s eligibility criteria……………………………………………………………………………………..29Table 3.8 Design leakage <strong>and</strong> potential coverage of poor <strong>OVC</strong> households intreatment locations ................................................................................................ 30Table 3.9 Proportion of <strong>OVC</strong> households in the treatment locations satisfying each ofthe programme’s poverty indicators – by location consumption tercile (%)............. 31Table 3.10 Distribution of eligible households in the treatment locations – by priorityranking <strong>and</strong> location consumption tercile (%)......................................................... 32Table 3.11 Administrative leakage <strong>and</strong> coverage of eligible households in the treatmentlocations ................................................................................................................ 33Table 4.1 Health <strong>and</strong> nutrition indicators – all children in <strong>OVC</strong> households ................ 35Table 4.2 Education indicators – all children in <strong>OVC</strong> households ............................... 36Table 4.3 Other welfare indicators – all children in <strong>OVC</strong> households ......................... 37Table 4.4 Household welfare indicators ..................................................................... 38Table 4.5 General community characteristics ............................................................. 39Table 4.6 Supply of health services ........................................................................... 40Table 4.7 Supply of education services ...................................................................... 41Table A.1 Health <strong>and</strong> nutrition indicators – all <strong>OVC</strong>s .................................................. 46Table A.2 Education indicators – all <strong>OVC</strong>s ................................................................. 47Table A.3 Other welfare indicators – all <strong>OVC</strong>s ............................................................ 48Table B.1 Proportion of children stunted, wasted <strong>and</strong> underweight by district –unweighted (%)...................................................................................................... 53Table B.2 Mean z-scores for HAZ, WAZ, WHZ by district ........................................... 55Table C.1 Mean household consumption expenditure per adult equivalent <strong>and</strong> budgetshares 57Table C.2 Consumption <strong>and</strong> asset indicators by district .............................................. 60Table C.3 Asset indicators by consumption quintile .................................................... 62x


