Kenya OVC-CT Programme Operational and Impact Evaluation
Kenya OVC-CT Programme Operational and Impact Evaluation
Kenya OVC-CT Programme Operational and Impact Evaluation

Create successful ePaper yourself
Turn your PDF publications into a flip-book with our unique Google optimized e-Paper software.
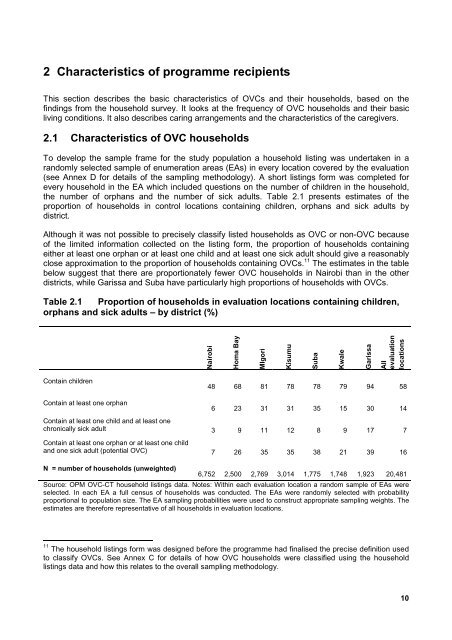
2 Characteristics of programme recipientsThis section describes the basic characteristics of <strong>OVC</strong>s <strong>and</strong> their households, based on thefindings from the household survey. It looks at the frequency of <strong>OVC</strong> households <strong>and</strong> their basicliving conditions. It also describes caring arrangements <strong>and</strong> the characteristics of the caregivers.2.1 Characteristics of <strong>OVC</strong> householdsTo develop the sample frame for the study population a household listing was undertaken in ar<strong>and</strong>omly selected sample of enumeration areas (EAs) in every location covered by the evaluation(see Annex D for details of the sampling methodology). A short listings form was completed forevery household in the EA which included questions on the number of children in the household,the number of orphans <strong>and</strong> the number of sick adults. Table 2.1 presents estimates of theproportion of households in control locations containing children, orphans <strong>and</strong> sick adults bydistrict.Although it was not possible to precisely classify listed households as <strong>OVC</strong> or non-<strong>OVC</strong> becauseof the limited information collected on the listing form, the proportion of households containingeither at least one orphan or at least one child <strong>and</strong> at least one sick adult should give a reasonablyclose approximation to the proportion of households containing <strong>OVC</strong>s. 11 The estimates in the tablebelow suggest that there are proportionately fewer <strong>OVC</strong> households in Nairobi than in the otherdistricts, while Garissa <strong>and</strong> Suba have particularly high proportions of households with <strong>OVC</strong>s.Table 2.1 Proportion of households in evaluation locations containing children,orphans <strong>and</strong> sick adults – by district (%)NairobiHoma BayMIgoriKisumuSubaKwaleGarissaAllevaluationlocationsContain children48 68 81 78 78 79 94 58Contain at least one orphan6 23 31 31 35 15 30 14Contain at least one child <strong>and</strong> at least onechronically sick adult 3 9 11 12 8 9 17 7Contain at least one orphan or at least one child<strong>and</strong> one sick adult (potential <strong>OVC</strong>) 7 26 35 35 38 21 39 16N = number of households (unweighted)6,752 2,500 2,769 3,014 1,775 1,748 1,923 20,481Source: OPM <strong>OVC</strong>-<strong>CT</strong> household listings data. Notes: Within each evaluation location a r<strong>and</strong>om sample of EAs wereselected. In each EA a full census of households was conducted. The EAs were r<strong>and</strong>omly selected with probabilityproportional to population size. The EA sampling probabilities were used to construct appropriate sampling weights. Theestimates are therefore representative of all households in evaluation locations.11 The household listings form was designed before the programme had finalised the precise definition usedto classify <strong>OVC</strong>s. See Annex C for details of how <strong>OVC</strong> households were classified using the householdlistings data <strong>and</strong> how this relates to the overall sampling methodology.10