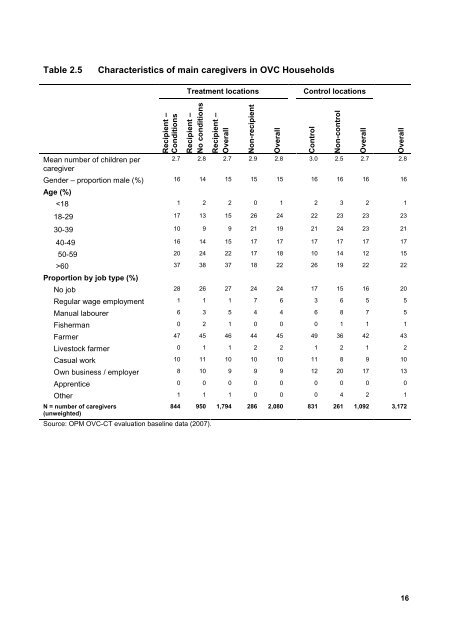
Table 2.5Characteristics of main caregivers in <strong>OVC</strong> HouseholdsTreatment locationsControl locationsMean number of children percaregiverRecipient –ConditionsRecipient –No conditionsRecipient –OverallNon-recipientOverall2.7 2.8 2.7 2.9 2.8 3.0 2.5 2.7 2.8Gender – proportion male (%) 16 14 15 15 15 16 16 16 16Age (%)60 37 38 37 18 22 26 19 22 22Proportion by job type (%)No job 28 26 27 24 24 17 15 16 20Regular wage employment 1 1 1 7 6 3 6 5 5Manual labourer 6 3 5 4 4 6 8 7 5Fisherman 0 2 1 0 0 0 1 1 1Farmer 47 45 46 44 45 49 36 42 43Livestock farmer 0 1 1 2 2 1 2 1 2Casual work 10 11 10 10 10 11 8 9 10Own business / employer 8 10 9 9 9 12 20 17 13Apprentice 0 0 0 0 0 0 0 0 0Other 1 1 1 0 0 0 4 2 1N = number of caregivers(unweighted)Source: OPM <strong>OVC</strong>-<strong>CT</strong> evaluation baseline data (2007).844 950 1,794 286 2,080 831 261 1,092 3,172ControlNon-controlOverallOverall16
3 Targeting effectiveness – are cash transfers reaching themost vulnerable children?This section looks at how effectively the programme reaches its target population. It examineswhether the programme is reaching <strong>OVC</strong>s <strong>and</strong> how effectively it is identifying poor <strong>OVC</strong>households to receive payments. It decomposes the second of these issues into whether thedistribution of recipients by districts reflects their level of poverty; whether the criteria used toidentify poor <strong>OVC</strong> households are appropriate; <strong>and</strong> how well these criteria are applied in practice.It also undertakes a limited comparison between the study population <strong>and</strong> the national population.3.1 Income poverty: targeting poor <strong>OVC</strong> householdsAs outlined in section 1, the programme was not intended to be primarily addressing poverty. It is arights-based programme intended to support fostering of orphans <strong>and</strong> other vulnerable children,<strong>and</strong> the development of their potential (human capital). The selection of districts where theprogramme would operate was based on information on HIV prevalence <strong>and</strong> operational issues(including which districts would receive donor support). Nevertheless, the programme decided totarget support to poor <strong>OVC</strong> households in the face of limited resources. After rejecting somealternative approaches, poor was defined using criteria suggested by local communities. Due tolimited funds, the programme also introduced an additional prioritisation process to select the mostvulnerable recipients from all households identified as eligible. The baseline survey was conductedat the point that only these beneficiaries were included in the programme. With additionalresources provided in the wake of the political violence in the country in 2007, the programmeexp<strong>and</strong>ed coverage to include eligible households that had been excluded by the prioritisationprocess. The baseline survey does not include this latter group. The basis on which futureprogramme expansion would be conducted is not clear: it is not necessarily the case that supportwould be provided to all households identified as eligible under the current criteria (<strong>and</strong> theanalysis presented below suggests it should not).This complicates the analysis of poverty targeting. At the time of the baseline, some 21% of <strong>OVC</strong>households were identified for inclusion in the programme. One element of the analysis presentedbelow therefore looks at how effectively the programme’s selection process has managed to selectthe poorest 21% of <strong>OVC</strong> households. This is because, if resources are limited to providingcoverage at this level, they should be targeted at the poorest of the potential recipients. This is areasonable basis for the analysis in the absence of any alternative, explicit definition of ‘mostvulnerable’ from the programme. However, since the programme in fact has the intention to reacha wider group of poor recipients, the analysis also addresses targeting issues with two higher-levelcut-offs, the $1 <strong>and</strong> $2 per day poverty lines.Section 2 showed that 38 percent of recipients fall below the $1 per day poverty line <strong>and</strong> 84percent fall below the $2 line. These figures need to be treated with some caution, since they aresensitive to the methods used to collect the data <strong>and</strong> to calculate them. 13 They cannot beconsidered comparable to similar estimates for other populations, such as the overall population in<strong>Kenya</strong>, due to this fact. They show, however, that many programme recipients are ‘poor’; <strong>and</strong> thathow many are considered poor is very sensitive to the particular poverty line that is chosen. Itseems questionable that a $2 per day cut-off is appropriate, for example, given that three-quarters13 Amongst other things, the survey used a cut-down consumption expenditure questionnaire based on recallthat might give different estimates from a more extensive list of consumption items <strong>and</strong> approaches basedon a diary. The consumption aggregate used in this analysis also excludes rent <strong>and</strong> is expressed per adultequivalent, whereas other analyses may use per capita measures.17