Kenya OVC-CT Programme Operational and Impact Evaluation
Kenya OVC-CT Programme Operational and Impact Evaluation
Kenya OVC-CT Programme Operational and Impact Evaluation

Create successful ePaper yourself
Turn your PDF publications into a flip-book with our unique Google optimized e-Paper software.
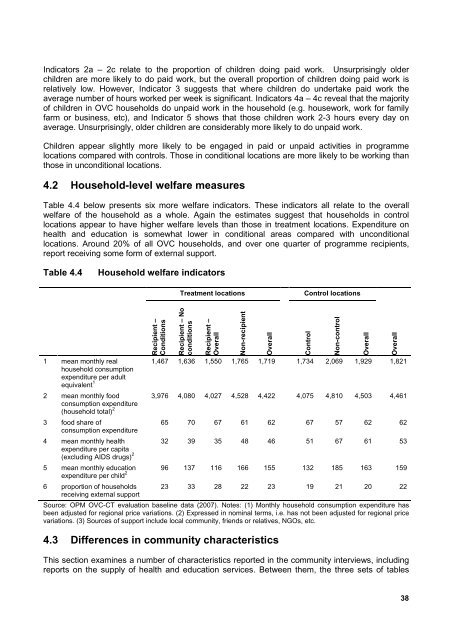
Indicators 2a – 2c relate to the proportion of children doing paid work. Unsurprisingly olderchildren are more likely to do paid work, but the overall proportion of children doing paid work isrelatively low. However, Indicator 3 suggests that where children do undertake paid work theaverage number of hours worked per week is significant. Indicators 4a – 4c reveal that the majorityof children in <strong>OVC</strong> households do unpaid work in the household (e.g. housework, work for familyfarm or business, etc), <strong>and</strong> Indicator 5 shows that those children work 2-3 hours every day onaverage. Unsurprisingly, older children are considerably more likely to do unpaid work.Children appear slightly more likely to be engaged in paid or unpaid activities in programmelocations compared with controls. Those in conditional locations are more likely to be working thanthose in unconditional locations.4.2 Household-level welfare measuresTable 4.4 below presents six more welfare indicators. These indicators all relate to the overallwelfare of the household as a whole. Again the estimates suggest that households in controllocations appear to have higher welfare levels than those in treatment locations. Expenditure onhealth <strong>and</strong> education is somewhat lower in conditional areas compared with unconditionallocations. Around 20% of all <strong>OVC</strong> households, <strong>and</strong> over one quarter of programme recipients,report receiving some form of external support.Table 4.4Household welfare indicatorsTreatment locationsControl locationsRecipient –ConditionsRecipient – NoconditionsRecipient –Overall1 mean monthly realhousehold consumptionexpenditure per adultequivalent 1 1,467 1,636 1,550 1,765 1,719 1,734 2,069 1,929 1,8212 mean monthly foodconsumption expenditure(household total) 2 3,976 4,080 4,027 4,528 4,422 4,075 4,810 4,503 4,4613 food share ofconsumption expenditureNon-recipientOverall65 70 67 61 62 67 57 62 624 mean monthly healthexpenditure per capita(excluding AIDS drugs) 2 32 39 35 48 46 51 67 61 535 mean monthly educationexpenditure per child 2 96 137 116 166 155 132 185 163 1596 proportion of householdsreceiving external support23 33 28 22 23 19 21 20 22Source: OPM <strong>OVC</strong>-<strong>CT</strong> evaluation baseline data (2007). Notes: (1) Monthly household consumption expenditure hasbeen adjusted for regional price variations. (2) Expressed in nominal terms, i.e. has not been adjusted for regional pricevariations. (3) Sources of support include local community, friends or relatives, NGOs, etc.ControlNon-controlOverallOverall4.3 Differences in community characteristicsThis section examines a number of characteristics reported in the community interviews, includingreports on the supply of health <strong>and</strong> education services. Between them, the three sets of tables38