Kenya OVC-CT Programme Operational and Impact Evaluation
Kenya OVC-CT Programme Operational and Impact Evaluation
Kenya OVC-CT Programme Operational and Impact Evaluation

Create successful ePaper yourself
Turn your PDF publications into a flip-book with our unique Google optimized e-Paper software.
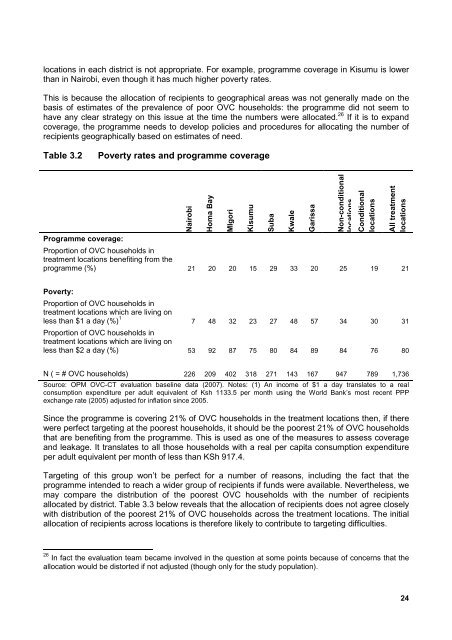
locations in each district is not appropriate. For example, programme coverage in Kisumu is lowerthan in Nairobi, even though it has much higher poverty rates.This is because the allocation of recipients to geographical areas was not generally made on thebasis of estimates of the prevalence of poor <strong>OVC</strong> households: the programme did not seem tohave any clear strategy on this issue at the time the numbers were allocated. 26 If it is to exp<strong>and</strong>coverage, the programme needs to develop policies <strong>and</strong> procedures for allocating the number ofrecipients geographically based on estimates of need.Table 3.2Poverty rates <strong>and</strong> programme coverage<strong>Programme</strong> coverage:NairobiHoma BayMIgoriKisumuSubaKwaleGarissaNon-conditionallocationsConditionallocationsAll treatmentlocationsProportion of <strong>OVC</strong> households intreatment locations benefiting from theprogramme (%) 21 20 20 15 29 33 20 25 19 21Poverty:Proportion of <strong>OVC</strong> households intreatment locations which are living onless than $1 a day (%) 1 7 48 32 23 27 48 57 34 30 31Proportion of <strong>OVC</strong> households intreatment locations which are living onless than $2 a day (%) 53 92 87 75 80 84 89 84 76 80N ( = # <strong>OVC</strong> households) 226 209 402 318 271 143 167 947 789 1,736Source: OPM <strong>OVC</strong>-<strong>CT</strong> evaluation baseline data (2007). Notes: (1) An income of $1 a day translates to a realconsumption expenditure per adult equivalent of Ksh 1133.5 per month using the World Bank’s most recent PPPexchange rate (2005) adjusted for inflation since 2005.Since the programme is covering 21% of <strong>OVC</strong> households in the treatment locations then, if therewere perfect targeting at the poorest households, it should be the poorest 21% of <strong>OVC</strong> householdsthat are benefiting from the programme. This is used as one of the measures to assess coverage<strong>and</strong> leakage. It translates to all those households with a real per capita consumption expenditureper adult equivalent per month of less than KSh 917.4.Targeting of this group won’t be perfect for a number of reasons, including the fact that theprogramme intended to reach a wider group of recipients if funds were available. Nevertheless, wemay compare the distribution of the poorest <strong>OVC</strong> households with the number of recipientsallocated by district. Table 3.3 below reveals that the allocation of recipients does not agree closelywith distribution of the poorest 21% of <strong>OVC</strong> households across the treatment locations. The initialallocation of recipients across locations is therefore likely to contribute to targeting difficulties.26 In fact the evaluation team became involved in the question at some points because of concerns that theallocation would be distorted if not adjusted (though only for the study population).24