Kenya OVC-CT Programme Operational and Impact Evaluation
Kenya OVC-CT Programme Operational and Impact Evaluation
Kenya OVC-CT Programme Operational and Impact Evaluation

Create successful ePaper yourself
Turn your PDF publications into a flip-book with our unique Google optimized e-Paper software.
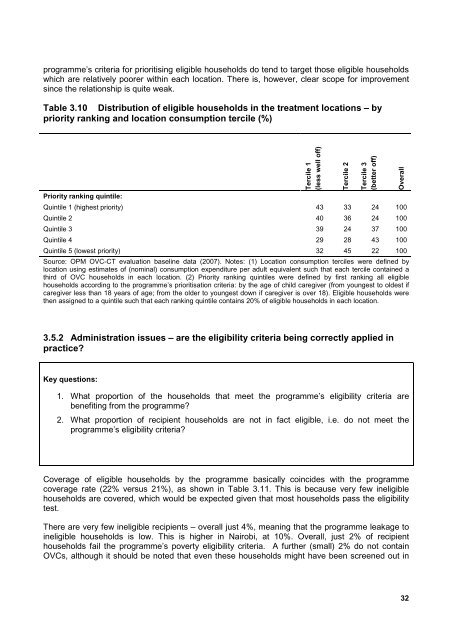
programme’s criteria for prioritising eligible households do tend to target those eligible householdswhich are relatively poorer within each location. There is, however, clear scope for improvementsince the relationship is quite weak.Table 3.10 Distribution of eligible households in the treatment locations – bypriority ranking <strong>and</strong> location consumption tercile (%)Priority ranking quintile:Tercile 1(less well off)Tercile 2Tercile 3(better off)Quintile 1 (highest priority) 43 33 24 100Quintile 2 40 36 24 100Quintile 3 39 24 37 100Quintile 4 29 28 43 100Quintile 5 (lowest priority) 32 45 22 100Source: OPM <strong>OVC</strong>-<strong>CT</strong> evaluation baseline data (2007). Notes: (1) Location consumption terciles were defined bylocation using estimates of (nominal) consumption expenditure per adult equivalent such that each tercile contained athird of <strong>OVC</strong> households in each location. (2) Priority ranking quintiles were defined by first ranking all eligiblehouseholds according to the programme’s prioritisation criteria: by the age of child caregiver (from youngest to oldest ifcaregiver less than 18 years of age; from the older to youngest down if caregiver is over 18). Eligible households werethen assigned to a quintile such that each ranking quintile contains 20% of eligible households in each location.Overall3.5.2 Administration issues – are the eligibility criteria being correctly applied inpractice?Key questions:1. What proportion of the households that meet the programme’s eligibility criteria arebenefiting from the programme?2. What proportion of recipient households are not in fact eligible, i.e. do not meet theprogramme’s eligibility criteria?Coverage of eligible households by the programme basically coincides with the programmecoverage rate (22% versus 21%), as shown in Table 3.11. This is because very few ineligiblehouseholds are covered, which would be expected given that most households pass the eligibilitytest.There are very few ineligible recipients – overall just 4%, meaning that the programme leakage toineligible households is low. This is higher in Nairobi, at 10%. Overall, just 2% of recipienthouseholds fail the programme’s poverty eligibility criteria. A further (small) 2% do not contain<strong>OVC</strong>s, although it should be noted that even these households might have been screened out in32