Kenya OVC-CT Programme Operational and Impact Evaluation
Kenya OVC-CT Programme Operational and Impact Evaluation
Kenya OVC-CT Programme Operational and Impact Evaluation

You also want an ePaper? Increase the reach of your titles
YUMPU automatically turns print PDFs into web optimized ePapers that Google loves.
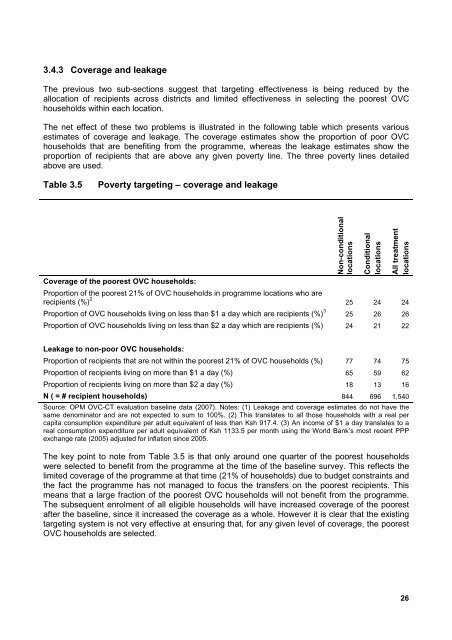
3.4.3 Coverage <strong>and</strong> leakageThe previous two sub-sections suggest that targeting effectiveness is being reduced by theallocation of recipients across districts <strong>and</strong> limited effectiveness in selecting the poorest <strong>OVC</strong>households within each location.The net effect of these two problems is illustrated in the following table which presents variousestimates of coverage <strong>and</strong> leakage. The coverage estimates show the proportion of poor <strong>OVC</strong>households that are benefiting from the programme, whereas the leakage estimates show theproportion of recipients that are above any given poverty line. The three poverty lines detailedabove are used.Table 3.5Poverty targeting – coverage <strong>and</strong> leakageCoverage of the poorest <strong>OVC</strong> households:Non-conditionallocationsConditionallocationsAll treatmentlocationsProportion of the poorest 21% of <strong>OVC</strong> households in programme locations who arerecipients (%) 2 25 24 24Proportion of <strong>OVC</strong> households living on less than $1 a day which are recipients (%) 3 25 26 26Proportion of <strong>OVC</strong> households living on less than $2 a day which are recipients (%) 24 21 22Leakage to non-poor <strong>OVC</strong> households:Proportion of recipients that are not within the poorest 21% of <strong>OVC</strong> households (%) 77 74 75Proportion of recipients living on more than $1 a day (%) 65 59 62Proportion of recipients living on more than $2 a day (%) 18 13 16N ( = # recipient households) 844 696 1,540Source: OPM <strong>OVC</strong>-<strong>CT</strong> evaluation baseline data (2007). Notes: (1) Leakage <strong>and</strong> coverage estimates do not have thesame denominator <strong>and</strong> are not expected to sum to 100%. (2) This translates to all those households with a real percapita consumption expenditure per adult equivalent of less than Ksh 917.4. (3) An income of $1 a day translates to areal consumption expenditure per adult equivalent of Ksh 1133.5 per month using the World Bank’s most recent PPPexchange rate (2005) adjusted for inflation since 2005.The key point to note from Table 3.5 is that only around one quarter of the poorest householdswere selected to benefit from the programme at the time of the baseline survey. This reflects thelimited coverage of the programme at that time (21% of households) due to budget constraints <strong>and</strong>the fact the programme has not managed to focus the transfers on the poorest recipients. Thismeans that a large fraction of the poorest <strong>OVC</strong> households will not benefit from the programme.The subsequent enrolment of all eligible households will have increased coverage of the poorestafter the baseline, since it increased the coverage as a whole. However it is clear that the existingtargeting system is not very effective at ensuring that, for any given level of coverage, the poorest<strong>OVC</strong> households are selected.26