Kenya OVC-CT Programme Operational and Impact Evaluation
Kenya OVC-CT Programme Operational and Impact Evaluation
Kenya OVC-CT Programme Operational and Impact Evaluation

Create successful ePaper yourself
Turn your PDF publications into a flip-book with our unique Google optimized e-Paper software.
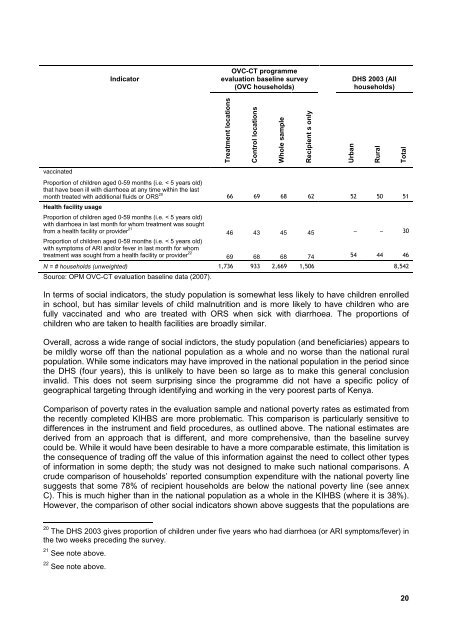
Indicator<strong>OVC</strong>-<strong>CT</strong> programmeevaluation baseline survey(<strong>OVC</strong> households)DHS 2003 (Allhouseholds)Treatment locationsControl locationsWhole sampleRecipient s onlyUrbanRuralTotalvaccinatedProportion of children aged 0-59 months (i.e. < 5 years old)that have been ill with diarrhoea at any time within the lastmonth treated with additional fluids or ORS 20 66 69 68 62 52 50 51Health facility usageProportion of children aged 0-59 months (i.e. < 5 years old)with diarrhoea in last month for whom treatment was soughtfrom a health facility or provider 21 46 43 45 45 – – 30Proportion of children aged 0-59 months (i.e. < 5 years old)with symptoms of ARI <strong>and</strong>/or fever in last month for whomtreatment was sought from a health facility or provider 22 69 68 68 74 54 44 46N = # households (unweighted) 1,736 933 2,669 1,506 8,542Source: OPM <strong>OVC</strong>-<strong>CT</strong> evaluation baseline data (2007).In terms of social indicators, the study population is somewhat less likely to have children enrolledin school, but has similar levels of child malnutrition <strong>and</strong> is more likely to have children who arefully vaccinated <strong>and</strong> who are treated with ORS when sick with diarrhoea. The proportions ofchildren who are taken to health facilities are broadly similar.Overall, across a wide range of social indictors, the study population (<strong>and</strong> beneficiaries) appears tobe mildly worse off than the national population as a whole <strong>and</strong> no worse than the national ruralpopulation. While some indicators may have improved in the national population in the period sincethe DHS (four years), this is unlikely to have been so large as to make this general conclusioninvalid. This does not seem surprising since the programme did not have a specific policy ofgeographical targeting through identifying <strong>and</strong> working in the very poorest parts of <strong>Kenya</strong>.Comparison of poverty rates in the evaluation sample <strong>and</strong> national poverty rates as estimated fromthe recently completed KIHBS are more problematic. This comparison is particularly sensitive todifferences in the instrument <strong>and</strong> field procedures, as outlined above. The national estimates arederived from an approach that is different, <strong>and</strong> more comprehensive, than the baseline surveycould be. While it would have been desirable to have a more comparable estimate, this limitation isthe consequence of trading off the value of this information against the need to collect other typesof information in some depth; the study was not designed to make such national comparisons. Acrude comparison of households’ reported consumption expenditure with the national poverty linesuggests that some 78% of recipient households are below the national poverty line (see annexC). This is much higher than in the national population as a whole in the KIHBS (where it is 38%).However, the comparison of other social indicators shown above suggests that the populations are20 The DHS 2003 gives proportion of children under five years who had diarrhoea (or ARI symptoms/fever) inthe two weeks preceding the survey.21 See note above.22 See note above.20