Kenya OVC-CT Programme Operational and Impact Evaluation
Kenya OVC-CT Programme Operational and Impact Evaluation
Kenya OVC-CT Programme Operational and Impact Evaluation

You also want an ePaper? Increase the reach of your titles
YUMPU automatically turns print PDFs into web optimized ePapers that Google loves.
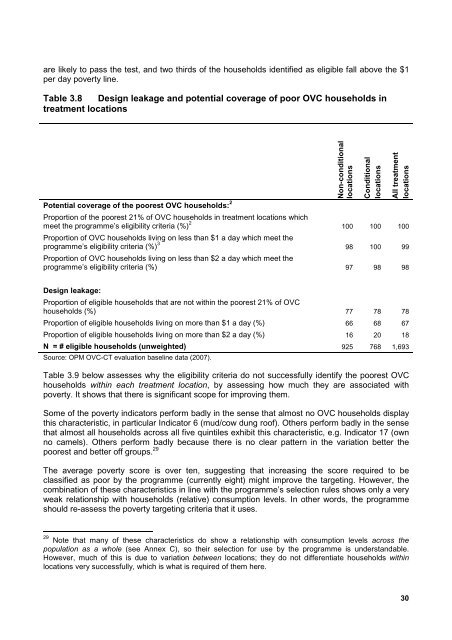
are likely to pass the test, <strong>and</strong> two thirds of the households identified as eligible fall above the $1per day poverty line.Table 3.8 Design leakage <strong>and</strong> potential coverage of poor <strong>OVC</strong> households intreatment locationsPotential coverage of the poorest <strong>OVC</strong> households: 2Non-conditionallocationsConditionallocationsAll treatmentlocationsProportion of the poorest 21% of <strong>OVC</strong> households in treatment locations whichmeet the programme’s eligibility criteria (%) 2 100 100 100Proportion of <strong>OVC</strong> households living on less than $1 a day which meet theprogramme’s eligibility criteria (%) 3 98 100 99Proportion of <strong>OVC</strong> households living on less than $2 a day which meet theprogramme’s eligibility criteria (%) 97 98 98Design leakage:Proportion of eligible households that are not within the poorest 21% of <strong>OVC</strong>households (%) 77 78 78Proportion of eligible households living on more than $1 a day (%) 66 68 67Proportion of eligible households living on more than $2 a day (%) 16 20 18N = # eligible households (unweighted) 925 768 1,693Source: OPM <strong>OVC</strong>-<strong>CT</strong> evaluation baseline data (2007).Table 3.9 below assesses why the eligibility criteria do not successfully identify the poorest <strong>OVC</strong>households within each treatment location, by assessing how much they are associated withpoverty. It shows that there is significant scope for improving them.Some of the poverty indicators perform badly in the sense that almost no <strong>OVC</strong> households displaythis characteristic, in particular Indicator 6 (mud/cow dung roof). Others perform badly in the sensethat almost all households across all five quintiles exhibit this characteristic, e.g. Indicator 17 (ownno camels). Others perform badly because there is no clear pattern in the variation better thepoorest <strong>and</strong> better off groups. 29The average poverty score is over ten, suggesting that increasing the score required to beclassified as poor by the programme (currently eight) might improve the targeting. However, thecombination of these characteristics in line with the programme’s selection rules shows only a veryweak relationship with households (relative) consumption levels. In other words, the programmeshould re-assess the poverty targeting criteria that it uses.29 Note that many of these characteristics do show a relationship with consumption levels across thepopulation as a whole (see Annex C), so their selection for use by the programme is underst<strong>and</strong>able.However, much of this is due to variation between locations; they do not differentiate households withinlocations very successfully, which is what is required of them here.30