Kenya OVC-CT Programme Operational and Impact Evaluation
Kenya OVC-CT Programme Operational and Impact Evaluation
Kenya OVC-CT Programme Operational and Impact Evaluation

Create successful ePaper yourself
Turn your PDF publications into a flip-book with our unique Google optimized e-Paper software.
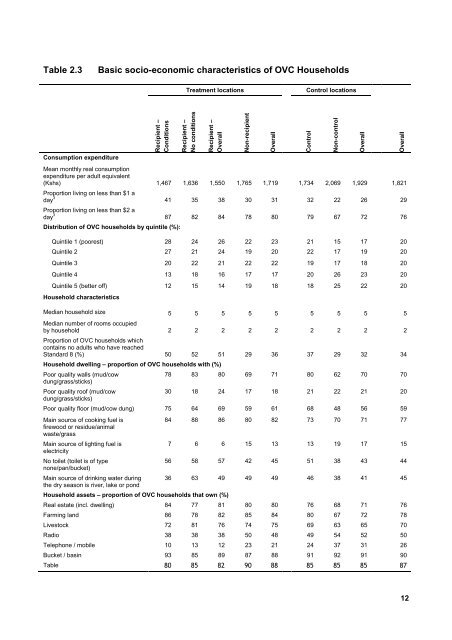
Table 2.3Basic socio-economic characteristics of <strong>OVC</strong> HouseholdsTreatment locationsControl locationsConsumption expenditureRecipient –ConditionsRecipient –No conditionsRecipient –OverallMean monthly real consumptionexpenditure per adult equivalent(Kshs) 1,467 1,636 1,550 1,765 1,719 1,734 2,069 1,929 1,821Proportion living on less than $1 aday 3 41 35 38 30 31 32 22 26 29Proportion living on less than $2 aday 3 87 82 84 78 80 79 67 72 76Distribution of <strong>OVC</strong> households by quintile (%):Non-recipientOverallControlNon-controlOverallOverallQuintile 1 (poorest) 28 24 26 22 23 21 15 17 20Quintile 2 27 21 24 19 20 22 17 19 20Quintile 3 20 22 21 22 22 19 17 18 20Quintile 4 13 18 16 17 17 20 26 23 20Quintile 5 (better off) 12 15 14 19 18 18 25 22 20Household characteristicsMedian household size 5 5 5 5 5 5 5 5 5Median number of rooms occupiedby household 2 2 2 2 2 2 2 2 2Proportion of <strong>OVC</strong> households whichcontains no adults who have reachedSt<strong>and</strong>ard 8 (%) 50 52 51 29 36 37 29 32 34Household dwelling – proportion of <strong>OVC</strong> households with (%)Poor quality walls (mud/cowdung/grass/sticks)Poor quality roof (mud/cowdung/grass/sticks)78 83 80 69 71 80 62 70 7030 18 24 17 18 21 22 21 20Poor quality floor (mud/cow dung) 75 64 69 59 61 68 48 56 59Main source of cooking fuel isfirewood or residue/animalwaste/grassMain source of lighting fuel iselectricityNo toilet (toilet is of typenone/pan/bucket)Main source of drinking water duringthe dry season is river, lake or pondHousehold assets – proportion of <strong>OVC</strong> households that own (%)84 88 86 80 82 73 70 71 777 6 6 15 13 13 19 17 1556 58 57 42 45 51 38 43 4436 63 49 49 49 46 38 41 45Real estate (incl. dwelling) 84 77 81 80 80 76 68 71 76Farming l<strong>and</strong> 86 78 82 85 84 80 67 72 78Livestock 72 81 76 74 75 69 63 65 70Radio 38 38 38 50 48 49 54 52 50Telephone / mobile 10 13 12 23 21 24 37 31 26Bucket / basin 93 85 89 87 88 91 92 91 90Table 80 85 82 90 88 85 85 85 8712