- Page 5 and 6:
School sampling design 63Within-sch
- Page 7 and 8:
6ICCS 2009 technical report
- Page 9 and 10:
Table 9.9: Numbers of NRC responses
- Page 11 and 12:
Table 12.37: Item parameters for sc
- Page 13 and 14:
Figure 12.7: Confirmatory factor an
- Page 15 and 16:
Table B.21.1: Allocation of student
- Page 17 and 18:
ICCS collected data from more than
- Page 19 and 20:
• A 30-minute school questionnair
- Page 21 and 22:
ReferencesAmadeo, J., Torney-Purta,
- Page 23 and 24:
Table 2.1: Test development process
- Page 25 and 26:
PanelingPaneling is a team-based ap
- Page 27 and 28:
Development of constructed-response
- Page 29 and 30:
Table 2.6: Field trial item mapping
- Page 31 and 32:
Released test itemsTwo clusters of
- Page 33 and 34:
32 ICCS 2009 technical report
- Page 35 and 36:
• Civic identities, comprising tw
- Page 37 and 38:
The context of the wider community
- Page 39 and 40:
The international options offered t
- Page 41 and 42:
Some of the constructs measured thr
- Page 43 and 44:
Discussion with national centers an
- Page 45 and 46:
44ICCS 2009 technical report
- Page 47 and 48:
was that the test would focus on kn
- Page 49 and 50:
Asian questionnaire developmentThe
- Page 51 and 52:
50 ICCS 2009 technical report
- Page 53 and 54:
Of these, the survey instruments (c
- Page 55 and 56:
Adaptation of the instrumentsIn the
- Page 57 and 58:
International translation verifiers
- Page 59 and 60:
Quality control monitor reviewIEA h
- Page 61 and 62:
Teacher target populationICCS defin
- Page 63 and 64:
Table 6.1: Population coverage and
- Page 65 and 66:
Table 6.2: School, student, and tea
- Page 67 and 68:
The team next selected a sample fro
- Page 69 and 70:
Systematic sampling was used for se
- Page 71 and 72:
In a small number of countries, the
- Page 73 and 74:
Class non-response adjustment (WGTA
- Page 75 and 76:
Teacher non-response adjustment (WG
- Page 77 and 78:
Calculating participation ratesFor
- Page 79 and 80:
Table 7.1: Unweighted participation
- Page 81 and 82:
The unweighted overall participatio
- Page 83 and 84:
Table 7.4: Weighted participation r
- Page 85 and 86:
Table 7.5: Categories into which co
- Page 87 and 88:
Table 7.7: Participation by country
- Page 89 and 90:
88ICCS 2009 technical report
- Page 91 and 92:
• The School Sampling Manual (ICC
- Page 93 and 94:
School coordinators were required t
- Page 95 and 96:
For countries administering the sch
- Page 97 and 98:
Scoring the ICCS assessmentThe succ
- Page 99 and 100:
Quality control throughout the data
- Page 101 and 102:
Table 8.3: Weighted percentages of
- Page 103 and 104:
ICCS International Study Center (20
- Page 105 and 106:
They received an overview of the st
- Page 107 and 108:
Survey administration activities du
- Page 109 and 110:
Table 9.3: Percentages of IQCM resp
- Page 111 and 112:
Table 9.5: Percentages of IQCM resp
- Page 113 and 114:
Table 9.7: Percentages of IQCM resp
- Page 115 and 116:
Table 9.9: Numbers of NRC responses
- Page 117 and 118:
Table 9.12: Numbers of NRC response
- Page 119 and 120:
The majority of countries used the
- Page 121 and 122:
ReferencesICCS International Study
- Page 123 and 124:
After the item-statistics review ha
- Page 125 and 126:
Documentation and structure checkFo
- Page 127 and 128:
Filter questions, which appeared in
- Page 129 and 130:
SummaryTo achieve a high standard o
- Page 131 and 132:
Test coverage and item dimensionali
- Page 133 and 134:
Table 11.1: Item total-score correl
- Page 135 and 136:
Assessment of scorer reliabilitiesT
- Page 137 and 138:
Table 11.3: Gender DIF estimates fo
- Page 139 and 140:
Table 11.4 shows the percentages of
- Page 141 and 142:
fell below 70 percent were removed.
- Page 143 and 144:
Table 11.6: National items excluded
- Page 145 and 146:
Table 11.7: Final item parameters u
- Page 147 and 148:
Table 11.9: Median test reliabiliti
- Page 149 and 150:
The approach chosen was essentially
- Page 151 and 152:
Figure 11.6: Scatterplot for link i
- Page 153 and 154:
Here, s 2 represents the variance o
- Page 155 and 156: Table 11.15: Reliabilities for Euro
- Page 157 and 158: ReferencesAdams, R. (2002). Scaling
- Page 159 and 160: their parents’ levels of educatio
- Page 161 and 162: Teacher questionnaireIndividual tea
- Page 163 and 164: In the case of items with more than
- Page 165 and 166: Figure 12.1: Summed category probab
- Page 167 and 168: Table 12.1: Reliabilities for scale
- Page 169 and 170: Figure 12.3: Confirmatory factor an
- Page 171 and 172: Table 12.4: Item parameters for sca
- Page 173 and 174: Figure 12.4: Confirmatory factor an
- Page 175 and 176: Table 12.6: Item parameters for sca
- Page 177 and 178: Table 12.8: Item parameters for sca
- Page 179 and 180: Table 12.9: Reliabilities for scale
- Page 181 and 182: Figure 12.7: Confirmatory factor an
- Page 183 and 184: Table 12.12: Item parameters for sc
- Page 185 and 186: Students’ attitudes toward instit
- Page 187 and 188: Figure 12.9: Confirmatory factor an
- Page 189 and 190: Table 12.16: Item parameters for sc
- Page 191 and 192: Table 12.17: Reliabilities for scal
- Page 193 and 194: Table 12.19: Reliabilities for scal
- Page 195 and 196: Table 12.21: Factor loadings and re
- Page 197 and 198: Table 12.22: Reliabilities for scal
- Page 199 and 200: Table 12.24: Reliabilities for scal
- Page 201 and 202: In Question 19, teachers were asked
- Page 203 and 204: Table 12.26: Reliabilities for scal
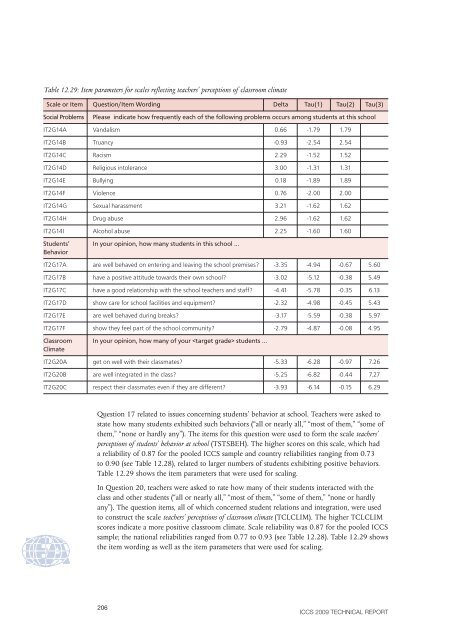
- Page 205: Figure 12.15: Confirmatory factor a
- Page 209 and 210: Teachers’ reports of teaching civ
- Page 211 and 212: Table 12.31: Item parameters for sc
- Page 213 and 214: School questionnairePrincipals’ r
- Page 215 and 216: Table 12.33: Item parameters for sc
- Page 217 and 218: Principals’ reports on the local
- Page 219 and 220: Table 12.35: Item parameters for sc
- Page 221 and 222: Principals’ reports on school cli
- Page 223 and 224: Table 12.37: Item parameters for sc
- Page 225 and 226: Table 12.39: Item parameters for sc
- Page 227 and 228: Table 12.40: Reliabilities for scal
- Page 229 and 230: Table 12.42: Reliabilities for scal
- Page 231 and 232: Figure 12.23: Confirmatory factor a
- Page 233 and 234: Figure 12.24 shows the results of t
- Page 235 and 236: Table 12.47: Item parameters for sc
- Page 237 and 238: Table 12.48: Reliabilities for scal
- Page 239 and 240: All of the items associated with Qu
- Page 241 and 242: Table 12.50: Reliabilities for scal
- Page 243 and 244: Figure 12.28 shows the results of t
- Page 245 and 246: In Question 4, students were asked
- Page 247 and 248: Table 12.56: Reliabilities for scal
- Page 249 and 250: Figure 12.30: Confirmatory factor a
- Page 251 and 252: Figure 12.31: Confirmatory factor a
- Page 253 and 254: Question 4 asked students to rate t
- Page 255 and 256: Table 12.63: Item parameters for sc
- Page 257 and 258:
Students’ perceptions of public s
- Page 259 and 260:
Figure 12.34: Confirmatory factor a
- Page 261 and 262:
260ICCS 2009 technical report
- Page 263 and 264:
Table 13.1: Numbers of sampling zon
- Page 265 and 266:
Table 13.2: Example of computation
- Page 267 and 268:
Table 13.3: National averages for c
- Page 269 and 270:
The ICCS international report also
- Page 271 and 272:
The software package HLM 6.08 (Raud
- Page 273 and 274:
Table 13.4: Coefficients of missing
- Page 275 and 276:
During the multiple regression anal
- Page 277 and 278:
Table 13.6: Coefficients of missing
- Page 279 and 280:
Table 13.7: Coefficients of missing
- Page 281 and 282:
SummaryThe jackknife repeated repli
- Page 283 and 284:
Staff at the IEA Data Processing an
- Page 285 and 286:
Republic of KoreaTae-Jun KimKorean
- Page 287 and 288:
Appendix B: Characteristics of nati
- Page 289 and 290:
Table B.3: Allocation of student sa
- Page 291 and 292:
B.6. Colombia• Night schools, wee
- Page 293 and 294:
Table B.8.2: Allocation of teacher
- Page 295 and 296:
B.12. Estonia• Schools for adults
- Page 297 and 298:
B.14. Greece• Night schools and s
- Page 299 and 300:
Table B.17.2: Allocation of teacher
- Page 301 and 302:
B.20. Korea• Special education sc
- Page 303 and 304:
B.23. Lithuania• Special needs sc
- Page 305 and 306:
Table B.26.2: Allocation of teacher
- Page 307 and 308:
Table B.29.1: Allocation of student
- Page 309 and 310:
Table B.32: Allocation of student s
- Page 311 and 312:
B.34. Slovenia• Dislocated units
- Page 313 and 314:
B.36. Sweden• Special needs schoo
- Page 315 and 316:
B.38. Thailand• Special education
- Page 317 and 318:
Table C1: Descriptions of cognitive
- Page 319 and 320:
Table C1: Descriptions of cognitive
- Page 321 and 322:
Table D.1: List of international an
- Page 323 and 324:
Table D.1: List of international an
- Page 325 and 326:
Table D.1: List of international an
- Page 327 and 328:
Table D.1: List of international an
- Page 329 and 330:
Table D.1: List of international an
- Page 331 and 332:
Table D.3: Years of further schooli
- Page 333 and 334:
332 ICCS 2009 technical report


