- Page 3 and 4:
CONFERENCE ORGANIZERS Boreskov Inst
- Page 5 and 6:
INTERNATIONAL ADVISORY BOARDHonorab
- Page 8 and 9:
PL-1Elucidating the Mechanism of He
- Page 10 and 11:
PL-3Bio-Inspired Hydrocarbon Oxidat
- Page 12:
PL-5From Mechanistic and Kinetic Un
- Page 16 and 17:
KL-1The Mechanism of the Fischer-Tr
- Page 18 and 19:
KL-2Catalysis from First Principles
- Page 20 and 21:
Mechanistic Aspects of Hydrogenatio
- Page 22 and 23:
KL-6Understanding Thermal and Photo
- Page 24 and 25:
KL-7Transition-Metal-Catalyzed Carb
- Page 26 and 27:
KL-8Selective Oxidation Catalysis w
- Page 28:
ORAL PRESENTATIONSSection I. Cataly
- Page 31 and 32:
OP-I-2Computational Insights into A
- Page 33 and 34:
OP-I-4Theoretical Insight on Cataly
- Page 35 and 36:
OP-I-6Self-Induced Electric Fields
- Page 37 and 38:
OP-II-1Direct Synthesis of Dimethyl
- Page 39 and 40:
OP-II-3Mechanism for the Reduction
- Page 41 and 42:
OP-II-5Mechanisms of Catalytic Reac
- Page 43 and 44:
OP-II-7Catalytic Conversion of Phen
- Page 45 and 46:
OP-III-1Mechanism of CH 4 Dry Refor
- Page 47 and 48:
OP-III-3Sulphur Ageing Mechanisms o
- Page 49 and 50:
OP-III-5Effect of Carbonization on
- Page 51 and 52:
OP-III-7A Single Model of Oscillati
- Page 53 and 54:
OP-III-9In Situ X-ray Studies of Mo
- Page 55 and 56:
OP-III-11Decomposition and Oxidatio
- Page 57 and 58:
OP-III-13Heterogeneous Hydrogenatio
- Page 59 and 60:
OP-III-15Mechanistic Studies on the
- Page 61 and 62:
OP-III-17Catalysis of Organic React
- Page 63 and 64:
OP-III-19Comparative Studies of Pd,
- Page 65 and 66:
OP-III-20Reactivity of Methoxy Spec
- Page 67 and 68:
OP-III-22Dehydration of Glycerol ov
- Page 69 and 70:
OP-III-24Catalytic Purification of
- Page 71 and 72:
OP-III-26Influence of the Hydrogen
- Page 73 and 74:
OP-III-28Mechanism of Low-Temperatu
- Page 75 and 76:
OP-III-30Mechanistic and Kinetic St
- Page 77 and 78:
OP-III-32Solid State Isotope Exchan
- Page 79 and 80:
OP-IV-2Deoxygenation of Biomass-Der
- Page 81 and 82:
OP-IV-4Ketonization of Valeric Acid
- Page 83 and 84:
OP-IV-520 ºC but its selectivity i
- Page 85 and 86:
OP-V-2Reaction Mechanism of Selecti
- Page 87 and 88:
OP-V-4Design of the Nanocrystalline
- Page 89 and 90:
OY-II-1The Role of Monovalent Nicke
- Page 91 and 92:
OY-II-3Highly Efficient, Regioselec
- Page 93 and 94:
OY-II-5Radical Processes Catalysed
- Page 95 and 96:
OY-III-1Methane Activation and Conv
- Page 97 and 98:
OY-III-3Unusually Active Nanostruct
- Page 99 and 100:
OY-III-5Studying the Influence of P
- Page 101 and 102:
OY-III-7Bimetallic Catalysts of Sel
- Page 103 and 104:
OY-IV-1Modeling of Associated Petro
- Page 105 and 106:
OY-IV-3Biomass Derived Lignan Hydro
- Page 107 and 108:
OY-IV-5Could Calcination Temperatur
- Page 109 and 110:
OY-IV-7Novel Catalysts for Bio-Fuel
- Page 111 and 112:
OY-V-2Ultrasonically Designed Metal
- Page 113 and 114:
OY-V-4Cu-Cr 2 O 3 -Al 2 O 3 Catalys
- Page 116 and 117:
PP-I-1Discrimination between Reacti
- Page 118 and 119:
PP-I-2Mechanism of H 2 O 2 Synthesi
- Page 120 and 121:
PP-I-4Oxidation of Allyl Complexes
- Page 122 and 123:
Computer Construction of Kinetic Mo
- Page 124 and 125:
PP-I-7On the Role of Energy Distrib
- Page 126 and 127:
PP-I-9Quantum Chemical Study of C-H
- Page 128 and 129:
PP-I-11Catalytic Transformations Du
- Page 130 and 131:
PP-I-13Quantum-Chemical Investigati
- Page 132 and 133:
PP-II-1New Bis(imino)pyridine Nicke
- Page 134 and 135:
PP-II-2References:[1] Bagrii E.I. /
- Page 136 and 137:
PP-II-4A Role of Hydroxyl Group in
- Page 138 and 139:
PP-II-6Water-Gas Shift Reaction Cat
- Page 140 and 141:
PP-II-8The Mechanism of the Control
- Page 142 and 143:
PP-II-10Metal Depended Regioselecti
- Page 144 and 145:
PP-II-12Preparation of Ionic Liquid
- Page 146 and 147:
PP-II-14Kinetic Schemes Evaluation
- Page 148 and 149:
PP-II-16Clean Synthesis of Adipic A
- Page 150 and 151:
Nickel-Mediated Cross-Coupling of A
- Page 152 and 153:
PP-II-20A New Nitrogen-Containing D
- Page 154 and 155:
PP-III-2Investigation of Mechanism
- Page 156 and 157:
PP-III-4The Mechanism of the Reacti
- Page 158 and 159:
PP-III-6Liquid-Phase Oxidation of H
- Page 160 and 161:
PP-III-8New Silica-Alumina Supports
- Page 162 and 163:
PP-III-10Selectivity Control of Pai
- Page 164 and 165:
PP-III-12Spectral and Catalytic Stu
- Page 166 and 167:
PP-III-14Oscillatory Behaviour duri
- Page 168 and 169:
PP-III-16Formation of Active Sites
- Page 170 and 171:
PP-II-18Preparation and Characteriz
- Page 172 and 173:
PP-III-20Ni-Based Catalysts for Ref
- Page 174 and 175:
PP-III-21the reaction mixture is 45
- Page 176 and 177:
PP-III-23Structure and Catalytic Ac
- Page 178 and 179:
PP-III-25Carbon Nanotube Synthesis
- Page 180 and 181:
PP-III-27Oxygen Isotope Exchange an
- Page 182 and 183:
PP-III-29Supercritical Fluid - CO 2
- Page 184 and 185:
PP-III-31Variation of Surface and T
- Page 186 and 187:
PP-III-33A Theoretical and Experime
- Page 188 and 189:
PP-III-35Reactivity of Ni and Co Hy
- Page 190 and 191:
PP-III-37Influence of the Electroni
- Page 192 and 193:
PP-III-39Nature of Low Bond Oxygen
- Page 194 and 195:
PP-III-41Resistance towards Sinteri
- Page 196 and 197:
PP-III-42varied in a range of 30-65
- Page 198 and 199:
PP-III-44Rationalisation of the Cat
- Page 200 and 201:
PP-III-46On Different Polarization
- Page 202 and 203:
PP-III-48Nanosize Catalysis New Nan
- Page 204 and 205:
PP-III-50Peculiarities of Partial O
- Page 206 and 207:
PP-III-51as it takes place for HDS.
- Page 208 and 209:
PP-III-53Mechanism of Мethanol Ste
- Page 210 and 211: PP-III-55Diffusive Model of Isoamyl
- Page 212 and 213: PP-III-57Mechanism of Propane Dehyd
- Page 214 and 215: PP-III-59Catalytic CO Oxidation ove
- Page 216 and 217: PP-III-61Binary Oxides of Transitio
- Page 218 and 219: PP-III-62total oxidation. Thus, cat
- Page 220 and 221: PP-III-65Physical-Chemical Properti
- Page 222 and 223: PP-III-67Study of Mechanism of Benz
- Page 224 and 225: PP-III-69Investigation of the Mecha
- Page 226 and 227: PP-III-70Results and discussion - T
- Page 228 and 229: PP-III-72Conversion of Methanol to
- Page 230 and 231: PP-III-74MCP Transformation on Rh-M
- Page 232 and 233: PP-III-75domain the ZrO 2 -15%Y 2 O
- Page 234 and 235: PP-III-77Mechanisms of Heterogeneou
- Page 236 and 237: PP-III-78Kinetic Regularities of 1-
- Page 238 and 239: PP-III-80Enantioselective Hydrogena
- Page 240 and 241: PP-III-82New Capabilities for XPS S
- Page 242 and 243: PP-III-84Catalytic Reaction Dynamic
- Page 244 and 245: PP-III-86FTIR Study of Adsorption a
- Page 246 and 247: PP-III-88A DFT Study of Electronic
- Page 248 and 249: PP-III-90Features of the Alcohols
- Page 250 and 251: PP-III-91Direct Synthesis of Hetero
- Page 252 and 253: PP-III-92shown that at supporting o
- Page 254 and 255: Effect of Dopants upon the Acidic P
- Page 256 and 257: PP-III-96Mathematical Modelling of
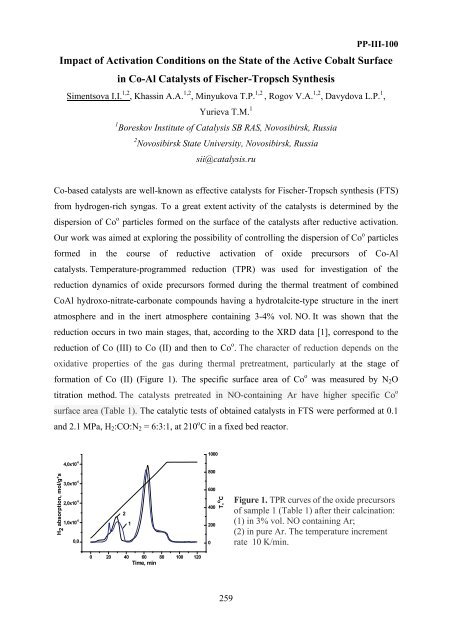
- Page 258 and 259: PP-III-98Different Catalytic Activi
- Page 262 and 263: PP-III-101Study of the Hydrogen/Iro
- Page 264 and 265: PP-III-103Results of Thermodynamic
- Page 266 and 267: PP-III-105Oligomerization of Ethyle
- Page 268 and 269: PP-III-107Identification of Surface
- Page 270 and 271: PP-III-109High Active Sulfate-Doppe
- Page 272 and 273: PP-III-111Cluster Modeling of Metal
- Page 274 and 275: PP-III-113Features of the Mechanism
- Page 276 and 277: PP-III-115Phenol Oxydation by PP-CW
- Page 278 and 279: PP-III-117Pt /Modified Kaolinite in
- Page 280 and 281: PP-III-118Modification of Heterogen
- Page 282 and 283: Studing the Routes of Hydrocarbon O
- Page 284 and 285: PP-III-122The Mechanism of Methanol
- Page 286 and 287: PP-IV-1The Promoting Effect of Rare
- Page 288 and 289: PP-IV-3Mechanistic Aspects of Catal
- Page 290 and 291: Steam Reforming of Bioethanol over
- Page 292 and 293: PP-IV-7Effect of Medium on Hemin Ox
- Page 294 and 295: PP-IV-9Hydrocracking and Hydroisome
- Page 296 and 297: PP-IV-11Conversion of Aspen-Wood an
- Page 298 and 299: PP-IV-13Ion Exchange Resin Immobili
- Page 300 and 301: PP-IV-15Comparative Study of Oxidat
- Page 302 and 303: PP-IV-16case unsaturated hydrocarbo
- Page 304 and 305: PP-IV-18H 2 S Purification from Bio
- Page 306 and 307: PP-IV-20Effect of Cu-Catalyst Based
- Page 308 and 309: PP-IV-22H 2 -Least Approaches for D
- Page 310 and 311:
PP-IV-24Combined Methods for Mono-,
- Page 312 and 313:
PP-V-2Oxygen Exchange and Degradati
- Page 314 and 315:
PP-V-4Efficient Photocatalytic Deco
- Page 316 and 317:
PP-V-6Supercritical Fluids as Solve
- Page 318 and 319:
PP-V-8Production of Highly Active D
- Page 320 and 321:
PP-V-10Electrocatalysis in Ionic Li
- Page 322 and 323:
PP-V-12Study of Free Charge Carrier
- Page 324 and 325:
PP-V-14Catalytic Decomposition of H
- Page 326 and 327:
List ofparticipantsABU BIEH Moursi
- Page 328 and 329:
CHOLACH AlexanderBoreskov Institute
- Page 330 and 331:
IVANCHEV Sergey StepanovichSt. Pete
- Page 332 and 333:
MALENGREAUX Charline MarieLaboratoi
- Page 334 and 335:
OLLÁR TamásCentre of Energy Resea
- Page 336 and 337:
SMIRNOV Mikhail Yu.Boreskov Institu
- Page 338 and 339:
ZEMLYANOV Dmitry YurievichPurdue Un
- Page 340 and 341:
ORAL PRESENTATIONS ................
- Page 342 and 343:
OP-III-14 Palma V., Castaldo F., Ci
- Page 344 and 345:
Section of the young scientistsOY-I
- Page 346 and 347:
PP-I-7 Molinari E., Tomellini M.On
- Page 348 and 349:
PP-III-3 Аliyev А.М., Mаmmadov
- Page 350 and 351:
PP-III-33 Goula M.A., Bereketidou O
- Page 352 and 353:
PP-III-66 Martirena M., Simonetti S
- Page 354 and 355:
PP-III-97 Serov Y.M., Sheshko T.F.S
- Page 356 and 357:
PP-IV-4 Deliy I.V., Bukhtiyarova G.
- Page 358:
PP-V-9 Manea F., Baciu A., Pop A.,
- Page 362:
Ведущая газоперера