Volume 2, ISSUE2/2011 - Review of Applied Socio-Economic ...
Volume 2, ISSUE2/2011 - Review of Applied Socio-Economic ...
Volume 2, ISSUE2/2011 - Review of Applied Socio-Economic ...

You also want an ePaper? Increase the reach of your titles
YUMPU automatically turns print PDFs into web optimized ePapers that Google loves.
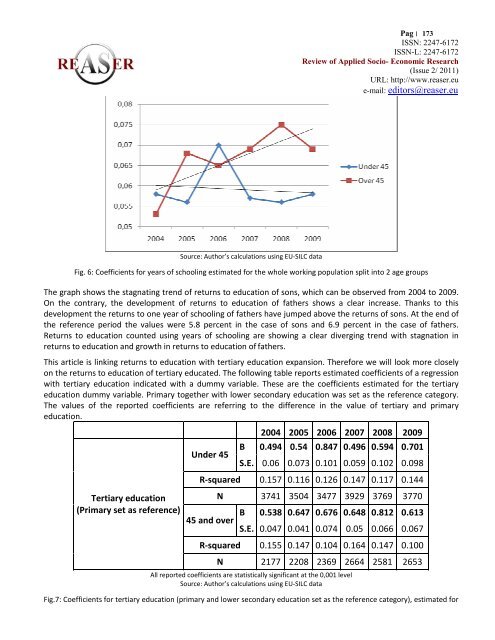
Pag׀ 173 ISSN: 2247-6172ISSN-L: 2247-6172<strong>Review</strong> <strong>of</strong> <strong>Applied</strong> <strong>Socio</strong>- <strong>Economic</strong> Research(Issue 2/ <strong>2011</strong>)URL: http://www.reaser.eue-mail: editors@reaser.euSource: Author’s calculations using EU-SILC dataFig. 6: Coefficients for years <strong>of</strong> schooling estimated for the whole working population split into 2 age groupsThe graph shows the stagnating trend <strong>of</strong> returns to education <strong>of</strong> sons, which can be observed from 2004 to 2009.On the contrary, the development <strong>of</strong> returns to education <strong>of</strong> fathers shows a clear increase. Thanks to thisdevelopment the returns to one year <strong>of</strong> schooling <strong>of</strong> fathers have jumped above the returns <strong>of</strong> sons. At the end <strong>of</strong>the reference period the values were 5.8 percent in the case <strong>of</strong> sons and 6.9 percent in the case <strong>of</strong> fathers.Returns to education counted using years <strong>of</strong> schooling are showing a clear diverging trend with stagnation inreturns to education and growth in returns to education <strong>of</strong> fathers.This article is linking returns to education with tertiary education expansion. Therefore we will look more closelyon the returns to education <strong>of</strong> tertiary educated. The following table reports estimated coefficients <strong>of</strong> a regressionwith tertiary education indicated with a dummy variable. These are the coefficients estimated for the tertiaryeducation dummy variable. Primary together with lower secondary education was set as the reference category.The values <strong>of</strong> the reported coefficients are referring to the difference in the value <strong>of</strong> tertiary and primaryeducation.Tertiary education(Primary set as reference)Under 452004 2005 2006 2007 2008 2009B 0.494 0.54 0.847 0.496 0.594 0.701S.E. 0.06 0.073 0.101 0.059 0.102 0.098R-squared 0.157 0.116 0.126 0.147 0.117 0.144N 3741 3504 3477 3929 3769 3770B 0.538 0.647 0.676 0.648 0.812 0.61345 and overS.E. 0.047 0.041 0.074 0.05 0.066 0.067R-squared 0.155 0.147 0.104 0.164 0.147 0.100N 2177 2208 2369 2664 2581 2653All reported coefficients are statistically significant at the 0,001 levelSource: Author’s calculations using EU-SILC dataFig.7: Coefficients for tertiary education (primary and lower secondary education set as the reference category), estimated for