Volume 2, ISSUE2/2011 - Review of Applied Socio-Economic ...
Volume 2, ISSUE2/2011 - Review of Applied Socio-Economic ...
Volume 2, ISSUE2/2011 - Review of Applied Socio-Economic ...

You also want an ePaper? Increase the reach of your titles
YUMPU automatically turns print PDFs into web optimized ePapers that Google loves.
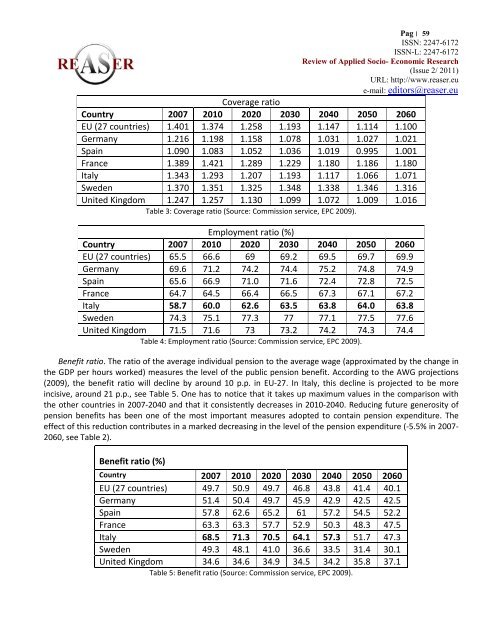
Pag׀ 59 ISSN: 2247-6172ISSN-L: 2247-6172<strong>Review</strong> <strong>of</strong> <strong>Applied</strong> <strong>Socio</strong>- <strong>Economic</strong> Research(Issue 2/ <strong>2011</strong>)URL: http://www.reaser.eue-mail: editors@reaser.euCoverage ratioCountry 2007 2010 2020 2030 2040 2050 2060EU (27 countries) 1.401 1.374 1.258 1.193 1.147 1.114 1.100Germany 1.216 1.198 1.158 1.078 1.031 1.027 1.021Spain 1.090 1.083 1.052 1.036 1.019 0.995 1.001France 1.389 1.421 1.289 1.229 1.180 1.186 1.180Italy 1.343 1.293 1.207 1.193 1.117 1.066 1.071Sweden 1.370 1.351 1.325 1.348 1.338 1.346 1.316United Kingdom 1.247 1.257 1.130 1.099 1.072 1.009 1.016Table 3: Coverage ratio (Source: Commission service, EPC 2009).Employment ratio (%)Country 2007 2010 2020 2030 2040 2050 2060EU (27 countries) 65.5 66.6 69 69.2 69.5 69.7 69.9Germany 69.6 71.2 74.2 74.4 75.2 74.8 74.9Spain 65.6 66.9 71.0 71.6 72.4 72.8 72.5France 64.7 64.5 66.4 66.5 67.3 67.1 67.2Italy 58.7 60.0 62.6 63.5 63.8 64.0 63.8Sweden 74.3 75.1 77.3 77 77.1 77.5 77.6United Kingdom 71.5 71.6 73 73.2 74.2 74.3 74.4Table 4: Employment ratio (Source: Commission service, EPC 2009).Benefit ratio. The ratio <strong>of</strong> the average individual pension to the average wage (approximated by the change inthe GDP per hours worked) measures the level <strong>of</strong> the public pension benefit. According to the AWG projections(2009), the benefit ratio will decline by around 10 p.p. in EU-27. In Italy, this decline is projected to be moreincisive, around 21 p.p., see Table 5. One has to notice that it takes up maximum values in the comparison withthe other countries in 2007-2040 and that it consistently decreases in 2010-2040. Reducing future generosity <strong>of</strong>pension benefits has been one <strong>of</strong> the most important measures adopted to contain pension expenditure. Theeffect <strong>of</strong> this reduction contributes in a marked decreasing in the level <strong>of</strong> the pension expenditure (-5.5% in 2007-2060, see Table 2).Benefit ratio (%)Country 2007 2010 2020 2030 2040 2050 2060EU (27 countries) 49.7 50.9 49.7 46.8 43.8 41.4 40.1Germany 51.4 50.4 49.7 45.9 42.9 42.5 42.5Spain 57.8 62.6 65.2 61 57.2 54.5 52.2France 63.3 63.3 57.7 52.9 50.3 48.3 47.5Italy 68.5 71.3 70.5 64.1 57.3 51.7 47.3Sweden 49.3 48.1 41.0 36.6 33.5 31.4 30.1United Kingdom 34.6 34.6 34.9 34.5 34.2 35.8 37.1Table 5: Benefit ratio (Source: Commission service, EPC 2009).